The 500 hPa configuration governs certain effects that play a vital part in determining Earth’s weather and climate. We want to know as much as possible about whatever may cause the configuration to be what it is, and to keep changing. Can we identify all of the different forces that determine the actual configuration of the image and its geographical location at any given time? A complete answer, which I find to be quite challenging, would add an important dimension to my overall thesis. As things now stand, once we see the image we know just where to look for jetstream winds to appear, can estimate how strong they will be, can develop a useful understanding of how they influence the movement of water vapor streams in the upper level of the troposphere and see what kind of results will most likely appear for surface air temperatures. These things are all surprisingly easy to study by referring to the weather maps, and the information is good to have for explaining current weather conditions, but only if we can substantially understand the causes for change in hPa configuration will we have the capability needed for bolstering the models that test for future changes in the global climate.
As often stated, I’m confident that a big part of the answer to configuration change is found in the making of its everyday response to changes in air temperatures at the surface. These changes affect upward forces of air pressure which counteract the downward gravitational force of the air at any specified higher level. The responses are generally predictable, and often turn out that way, but not always, and often not well-timed, implying that other forces and factors must be coming into play. What are they, and where do they come from? Let me show some everyday examples from today’s maps, this time the global ones. First, today’s 500 hPa configuration, which is every bit as jumbled as it was yesterday in the Northern Hemisphere, though not so much in the south except for some signs of internal weakness in the blue zone:

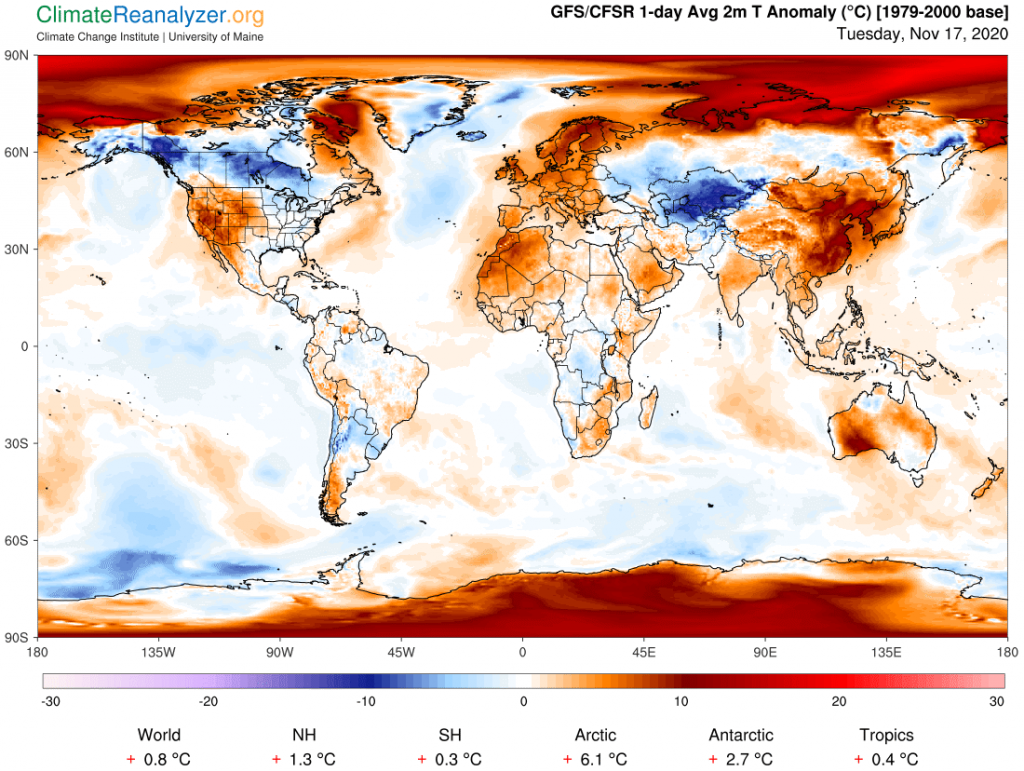
Now for the corresponding anomaly map. First off, note that the Arctic region as a whole is showing an amazing +6.1C anomaly today, while the south is not too shabby with a +2.7. Otherwise, notice how the NH outside of the Arctic is sprinkled with a number of both very warm anomalies and very cold ones, all of which can be examined to see how well their borders line up with hPa readings. The anomalies can all be checked out for attribution to influence from the presence of overhead water vapor, by using other maps, but we can skip over that part. The anomalies as we see them all assure us of temperatures high or low enough, in principle, to have effects capable of gaining a response we can look for on the 500hPa map. If you have the time, give it a try.

What I see in some cases is a nearly perfect relationship between the two images, but in others there are distortions and even some apparent conflicts, making it seem as if responses may be taking more than enough time to either appear or disappear. Or perhaps something unexpected may be interfering with the normal response. There is also the possibility that the configuration as a whole is always in motion, laterally, most surely from west to east, that continues unabated unless something interferes that can hold a part of it back from moving. Such an effect could be the cause of the kind of twisted distortions we are seeing right now, giving support to suggestions of one or more powerful feedback loops being in play. Such loops would still be subject to requirements governing how and when they begin and how they end, all very unclear.
Having complete knowledge of how these configurations are formed each day would still not answer the ultimate question: Is it possible for the configurations to undergo a sort of phase change, independent of ordinary seasonality factors, causing their movement from a state of relative stability to something much less stable, having unforeseen consequences? I can do no more than open up the question, and recommend that it be considered.
Carl