In the general category of extreme happenings, the most interesting spot on the planet today must be the South China Sea, where a total area about the same size as India is reporting a solid Precipitable Water reading of 70 to 75kg. I’ve never before seen anything like it in magnitude, and want the picture to be saved here as a permanent record:
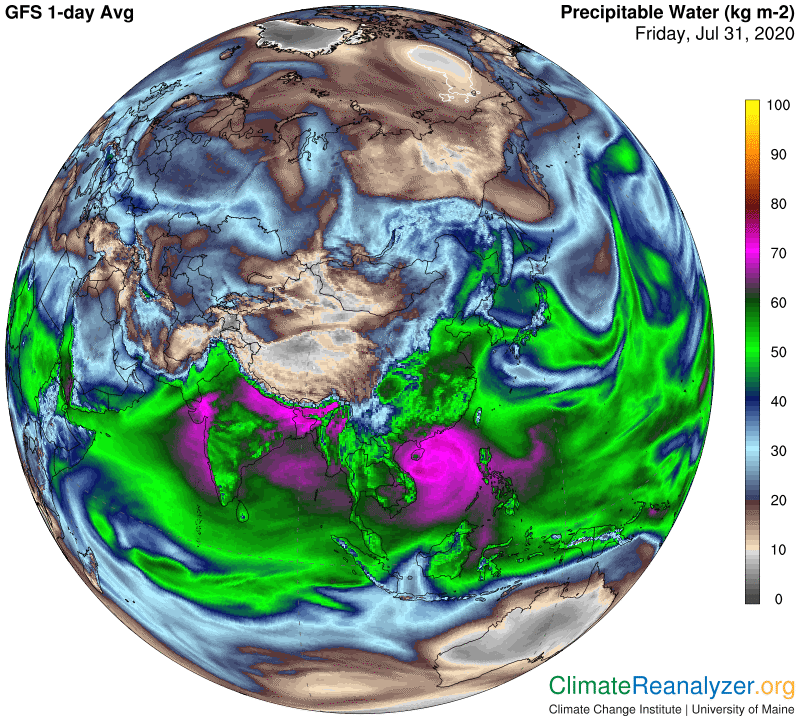
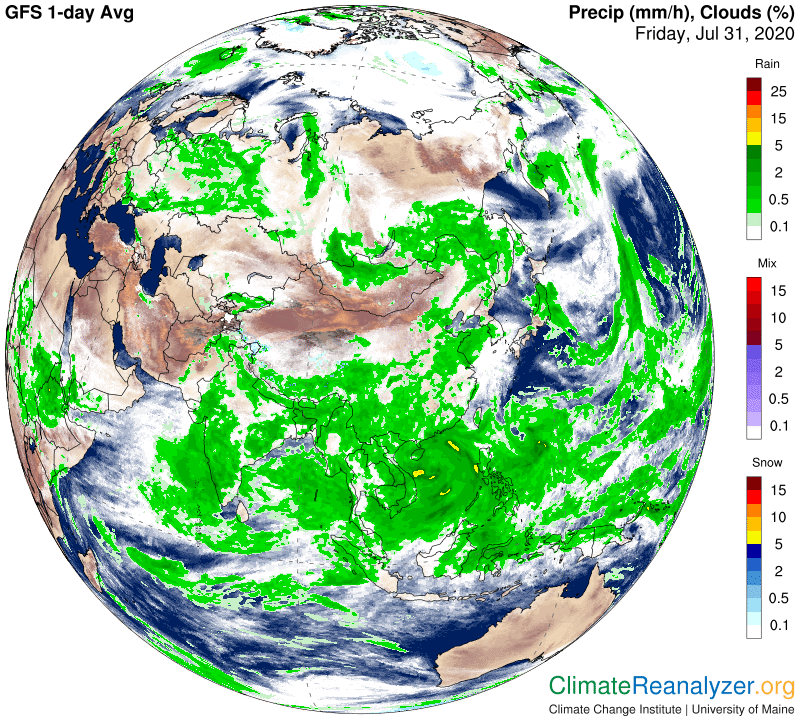
Why so much evaporation? The surface temperature is certainly high at 31C in places, otherwise more like the 30C that is elsewhere normal in this part of the world. The difference-maker at the moment is probably a strong wind, nothing like a hurricane but a steady 25mph and up. What we are really interested in is how much rain is being produced, and where is it landing? Luckily for everyone, the heaviest downfall is right back into the ocean body it came from, but the entire neighborhood of land is still getting a good soaking:
What about air temperatures—how are they affected by all this rain? From what I can see, speeding up the rate of evaporation may be having a modest cooling effect over the South China Sea, in accord with the basic principles of physics. Otherwise, tropical ocean air tends to consistently show a slight warming over what it was like a few decades ago. As for surrounding land areas, what we see on the anomaly map is that places getting heavy rain in the region between India and southern China are currently experiencing warm anomalies of several degrees. This is in spite of their having massive cloud cover and much-reduced solar radiation, which doesn’t seem quite right by external (or North American) standards, but here is what the map is showing:
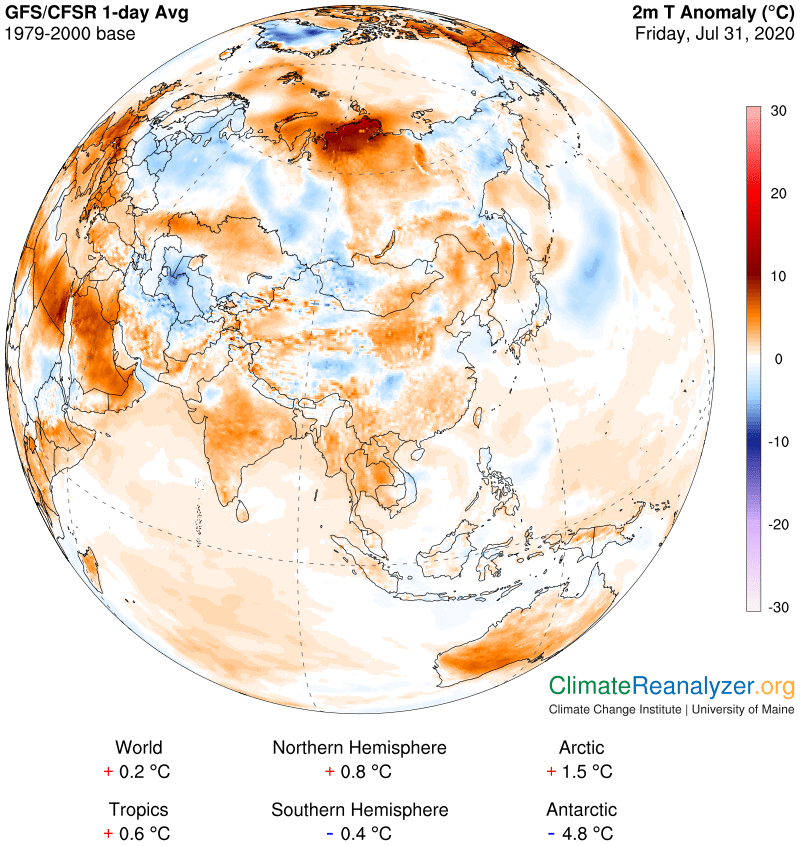
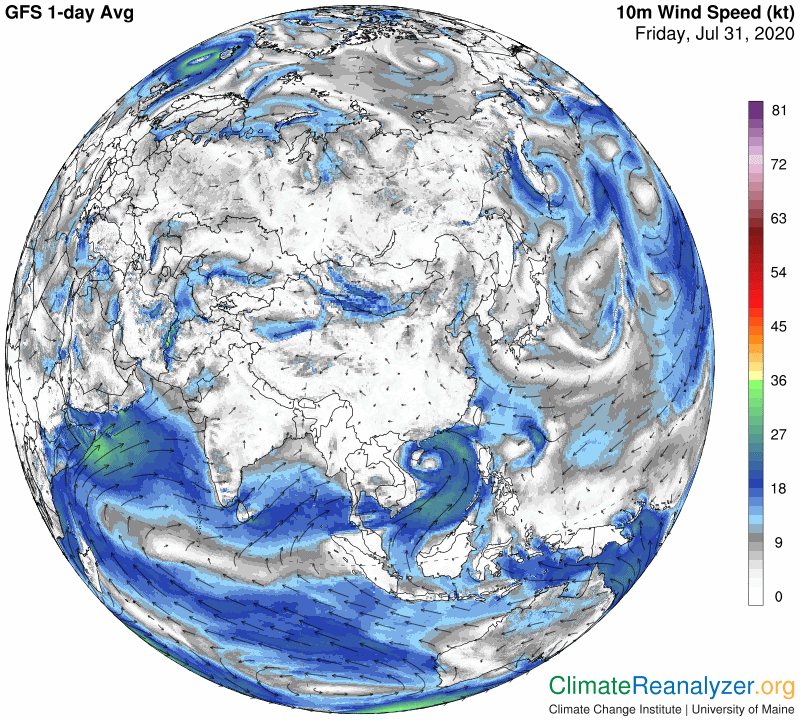
So how should we explain these warm anomalies? Maybe it’s just because heavy monsoon rains were possibly equal to this on an average day at this time of year in the past, while otherwise the climate today is overall warmer because of ordinary greenhouse effects. There is one other possibility that is more specific, involving wind. When the humidity level is high an absolute minimum of wind would help to keep the evaporation of rainwater from the surface at a minimum, thus preventing what would normally be a cooling effect on close-by air temperatures. The past could have been more windy, which I am not sure about, but we can at least check out what speeds are like today. This next map does lend support to the idea. It also highlights the current amazingly stark contrast between wind velocities over land and sea in this part of the world, which seems unreasonably extreme, giving us something else to wonder about.
Carl