Why is it so cold? According to the weather maps, average air temperatures across the entire planetary surface are about the same today as they were around thirty years ago on the same day of the year. This is considered relatively cold by recent standards, and also when giving consideration to the large increase in greenhouse gases that have been added to the atmosphere during those years. I have some personal ideas related to the current cold snap in the Northern Hemisphere, but first let’s open a map showing how warm and cold anomalies are registered today in all parts of the globe. Take a good look at the regional numbers below the map and make comparisons among them:
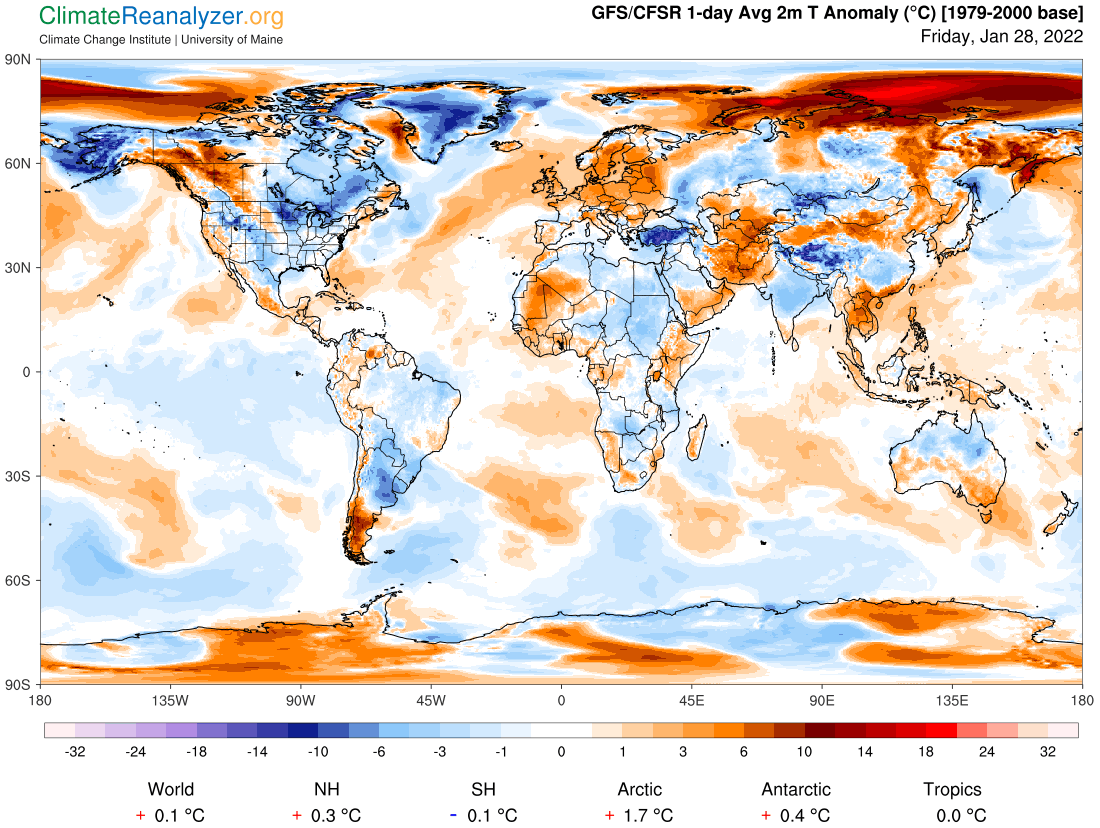
The tropical zone is an important factor, because it is usually about +0.5C and very stable from day to day, year around. It dropped down to near the current level soon after the Tonga volcano eruption two weeks ago and has not come back. Emissions from the eruption should continue to circle the globe in the stratosphere for months, mostly over the tropical belt, blocking sunlight as they do so. The SH at -0.1C has not strayed far from that level for much of the past year, largely because of the cool Pacific Ocean under the influence of an ongoing La Nina event, a cool Southern Ocean under the increasing influence of cold Antarctic meltwater, and a continuing relative coldness of Antarctica’s surface due to atmospheric conditions that seem to be stuck in place. I’ll get back to the NH, but first it will help to display a map that singles out global sea surface temperature anomalies, which have their own level of interest and importance:
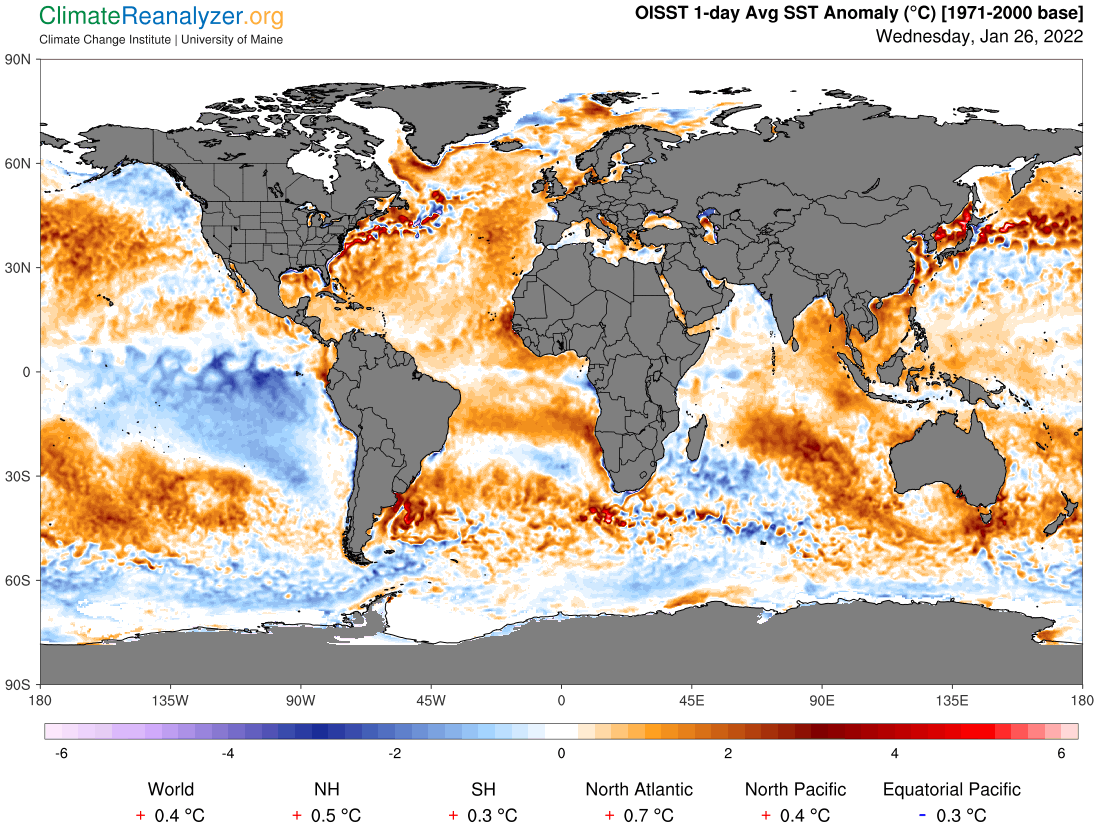
Here the anomaly of +0.4C is fairly normal these days. Bear in mind that 70% of the global surface is covered by ocean water—more than double that of land areas. We don’t have a current number for land surfaces alone, but it must be very low, well below zero, in order to have the needed ability to bring the total global anomaly all the way down to +0.1C. Remember also that for the last 50 years or so land areas have been warming up about twice as fast as ocean surfaces, which gives you a good idea of how far below normal land areas really are right now. Look again at all of the “blue land” in the top map. It can’t be that way for lack of well-mixed greenhouse gases in the atmosphere, which are decidedly up, so why so much blue? What could make things so cold right now, especially in the NH, where land area is relatively large, and ocean surfaces are predominantly warmer than ever in this era?
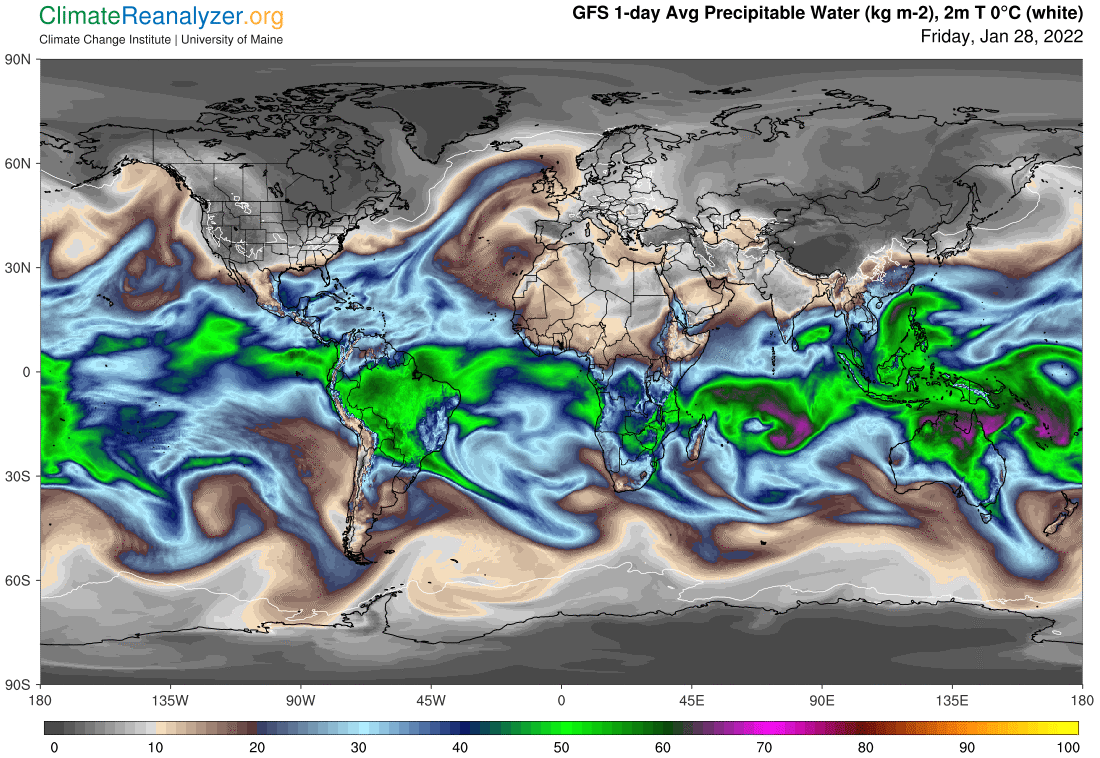
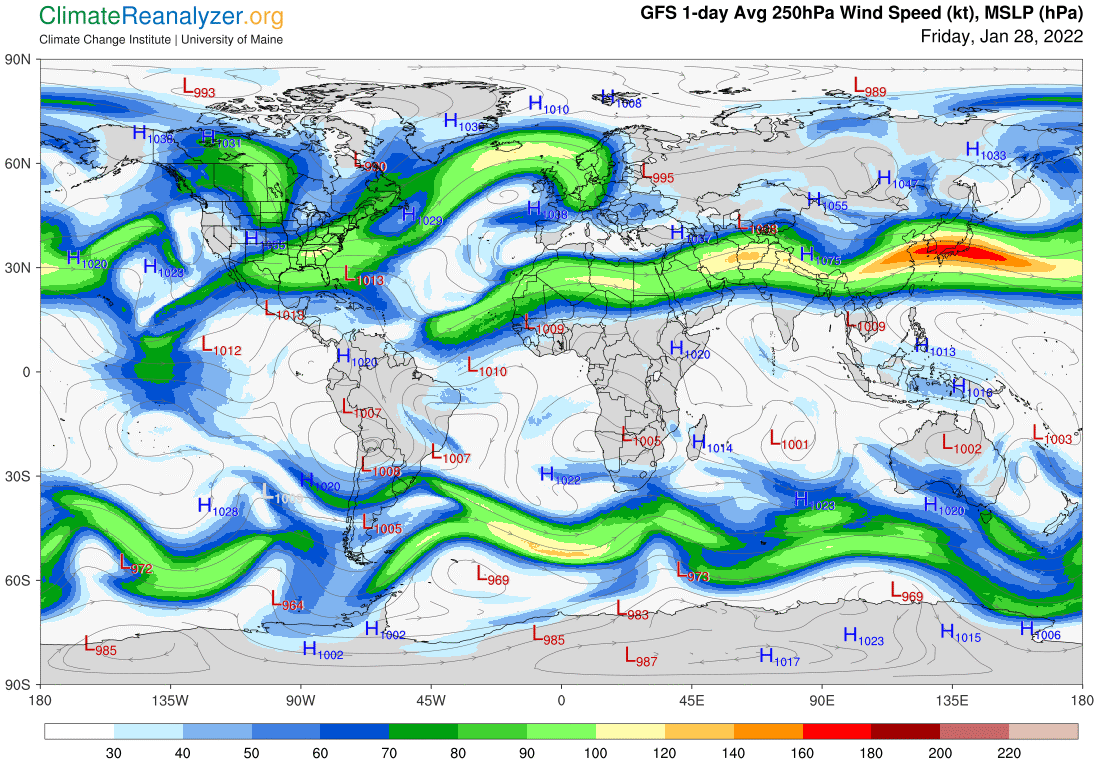
It all goes back to my own personal understanding that about two-thirds of the area of this planet, or basically everything outside of the tropical belt, receives only a minor portion of its warming energy directly from the action of well-mixed greenhouse gases. A larger portion is generated by just one very powerful gas, water vapor, augmented by the similar action of aerosols created by water vapor, collectively known as precipitable water (PW). A significant part of the action of PW is generated by concentrations of this material that travel in irregular bodies of river-like streams, known as atmospheric rivers (ARs), at high altitude over all surfaces in the mid to upper latitudes. These streams are created by evaporation of warm tropical waters that have gained their energy from the action of greenhouse gases of all types that are constantly present in the tropical zone. Once created and lofted to high a altitude the ARs are carried poleward in a natural way along with various currents of air. This movement is constantly subjected to interruption or course changes by encounters with jetstream winds that also exist at the same altitude. The effect of these encounters is strong and variable, being largely dependent on the variable strength and positioning of the jetstream winds in each hemisphere. Currently, that effect happens to be quite large, and favors a temporary distorting of the movement of ARs in ways that prevent a normal amount of greenhouse heating for numerous locations on the surface. The two maps that follow provide images of the two types of streams that interact in this way, with notable differences in each hemisphere, all of which has been detailed in principal by a number of earlier letters:
Carl