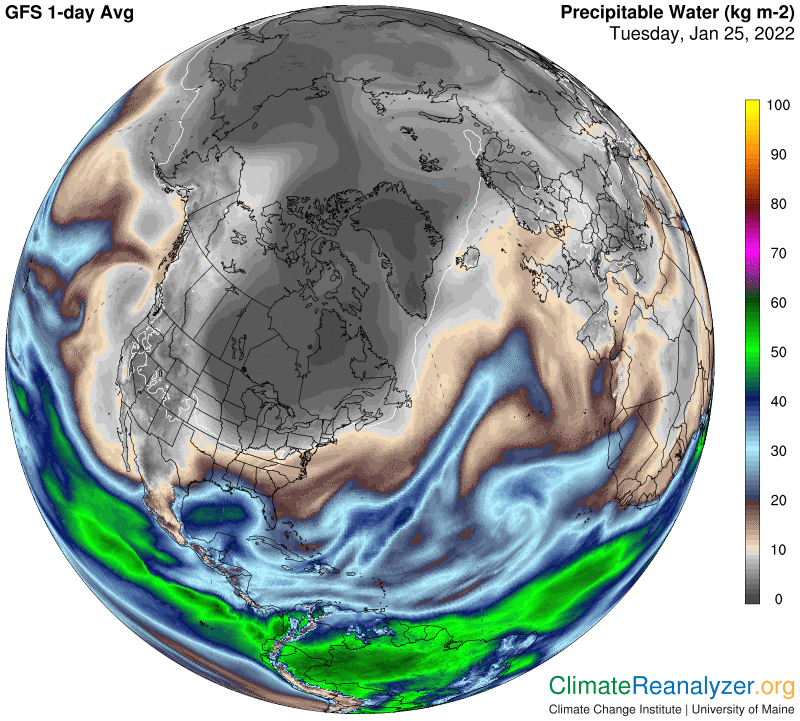
Two large atmospheric rivers (ARs), one originating in the Pacific and the other in the Atlantic, have extended their reach deep into the heart of the polar zone—so deep that now only a thin band of territory separates their leading edges. Here is how they look on the precipitable water (PW) weather map. (ARs, you must remember, are entirely composed of PW, and have a dominating effect on their measured strength.) Move your eyes close to the screen and use some magnification, so you can clearly see the “bridge” of separation, which maintains the same low PW reading that is typical of concentrations elsewhere within the polar zone at this time of year:
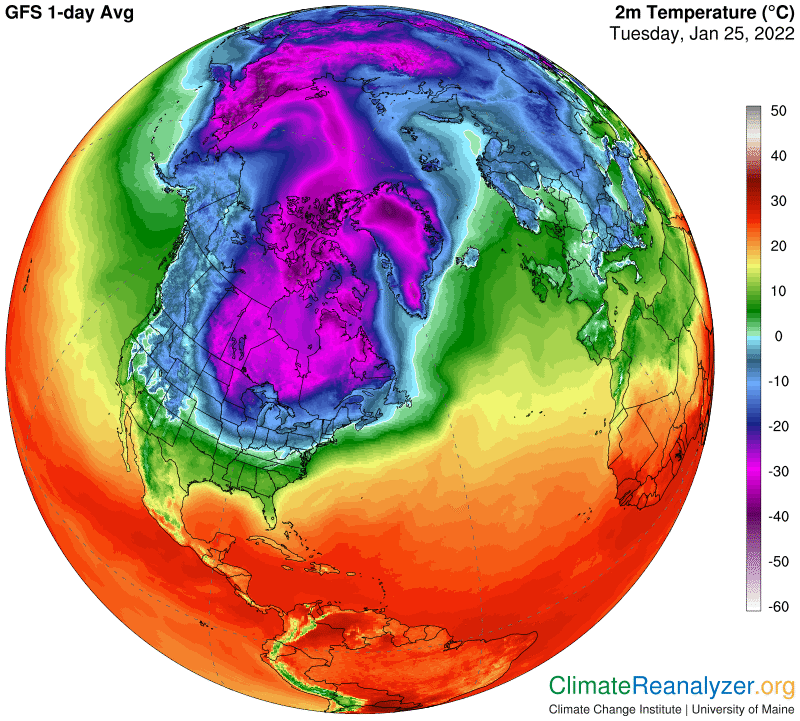
The next map shows how temperatures are affected by the encroachment of these two ARs. In the center part of the bridge area we get a reading of -35C. On either side, as far out as where you see the darkest blue shading, the reading is -20C— a figure that happens to be replicated as far south as northern Iowa! Most of central North America is being ignored by even a modest level of AR treatment these days, and is bitterly cold.
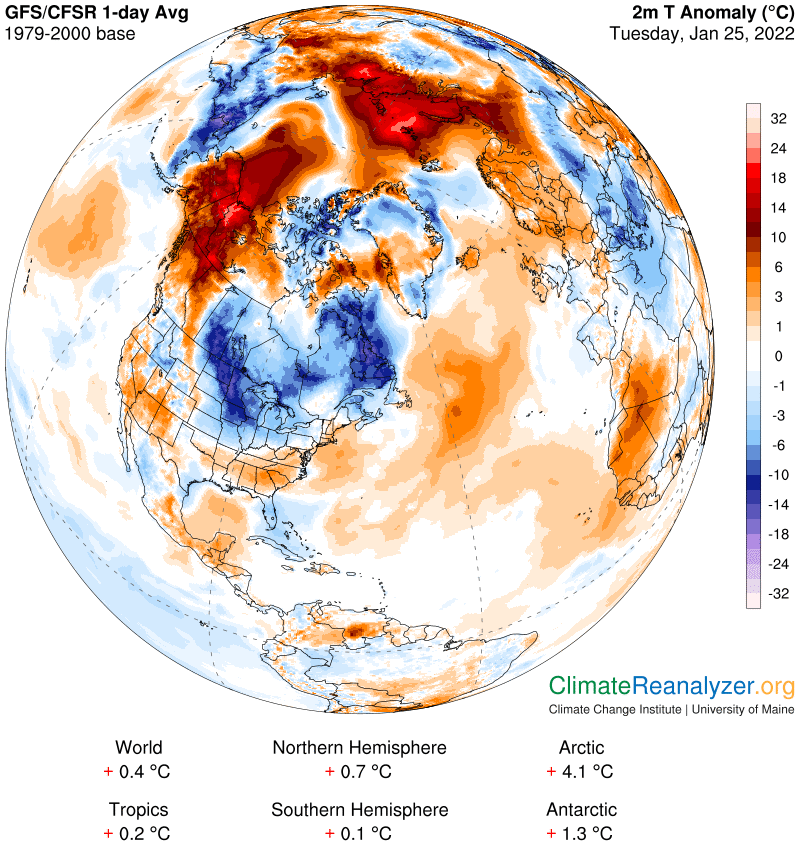
A temperature pattern of this sort is bound to result in some deep differentials on the anomaly map that follows. In the Arctic, if you magnify, you can find two or three small spots that are as much as 22C (40F) above normal, and many more spots at +20C. Western Minnesota, on the other hand, has a region of cold, at -30C (-16F) in the above map, that is 15C (27F) below normal.
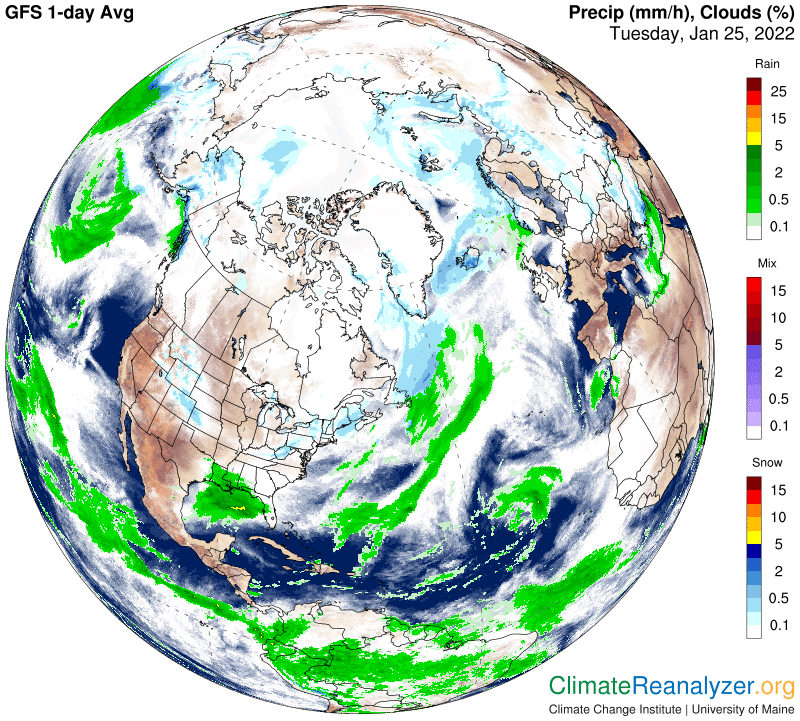
ARs, being entirely composed of PW, are naturally responsible for producing large amounts of precipitation as well as temperature increases. The next map shows how both of these rivers are doing their share. I want to point out that the precipitation produced by any AR tends to be absent at times and generally intermittent because of complex factors that are involved in the ongoing stages of condensation process. The greenhouse energy effect of ARs, which is responsible for all the temperature anomalies, is much more regular. It still depends on how the weight of PW particles is distributed across the whole body of an AR, and how fast the river is flowing, but it never stops working.
This extraordinary amount of warming in the Arctic, now up by 4.1C over the daily average from 30-some years ago, is a concern even if nothing is actually thawing. The surface will still be absorbing more than the usual amount of incoming radiation, which favors an earlier breakup of ocean ice cover when spring arrives. We’ll watch to see how long this truly major heatwave endures, potentially augmented by feedback effects.
Carl