When you open Today’s Weather Maps https://climatereanalyzer.org/wx/DailySummary/#t2 and click on Precipitable Water the map you get is really two maps in one. It also shows you the location of every atmospheric river in operation for that day. If you scroll down to the global map this is a good example of what you are likely to see:
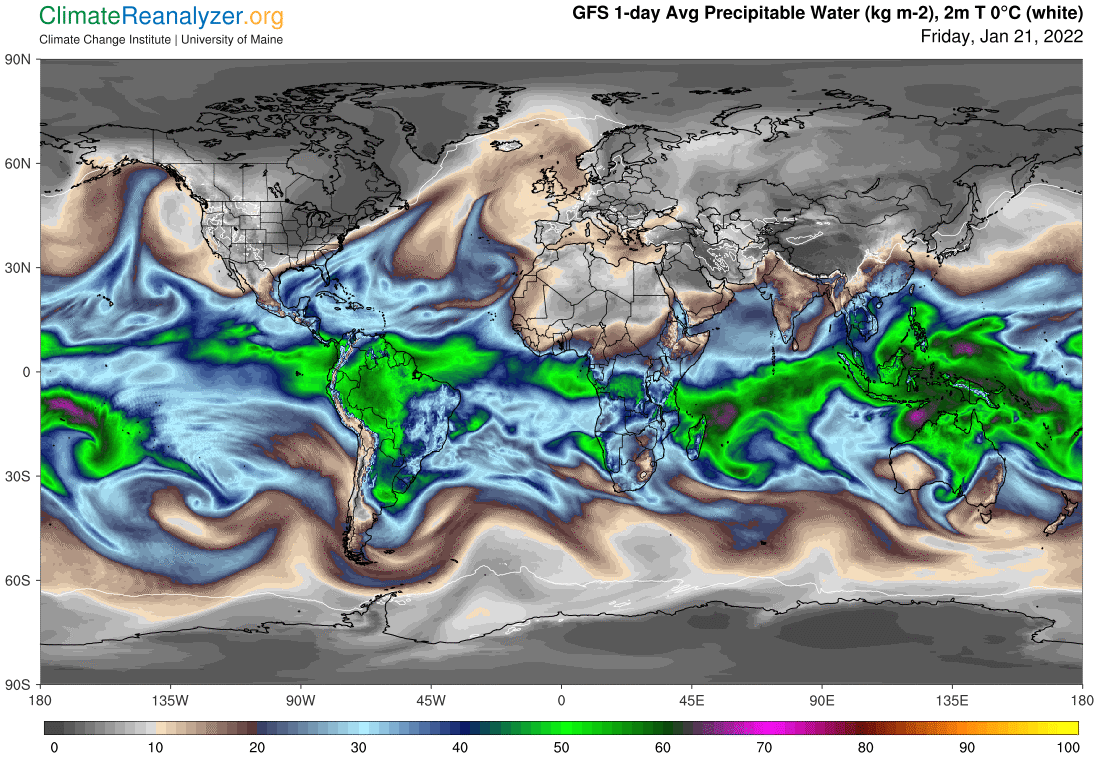
All of those spiky or lumpy things that bud out and move away from the center from starting points of about 30 degrees of latitude in each hemisphere are individual images of ARs. There are normally a total of a dozen or so at any one time. Their locations are fairly regular but not fixed, as riverbeds keep slipping and sliding. They all originate either in warm bodies of water along the borders of the central tropical belt or from a major region of tropical rainforest. They tend to disintegrate from day to day while their contents are flowing in a generally easterly direction with a poleward bias. End points are usually marked by well-dispersed remnants. (See the animated view at http://tropic.ssec.wisc.edu/real-time/mtpw2/product.php.)
What the map imagery actually depicts is a measure of the total amount of PW (by weight) within continuous vertical sections of the atmosphere from the surface to the extreme top. Each AR image on the map represents only a portion of that total, but its a very large portion. The PW material in the atmosphere below the body of an AR, or off to the side, most of which is simply vapor, will be lower in amount and less of a contributor to the motion expressed by the imagery. Areas at high altitude between the rivers will generally contain bits of debris left over from previous rivers, still floating around for awhile on their own accord. Otherwise, most of the PW in Earth’s atmosphere as a whole is not associated with any AR. It may exist in consistently high quantities throughout the interior of the tropical belt at all altitudes or else in steadily diminishing quantities in higher latitudes but below the altitude containing ARs, extending across all regions of the atmosphere between the tropics and the poles.
ARs are best known for their ability to distribute massive amounts of precipitation over virtually all regions of the planet between the tropical belt and the poles. The mechanism itself is extraordinary, and highly beneficial to land-based life forms in extratropical latitudes that need good watering. The very same mechanism does double-duty for life enhancement in the very same places by delivering sources of energy that are just right for the creation of temperature moderation and regularity. This mechanism makes use of the fact that ARs are composed entirely of PW, and PW is in fact an efficient generator of greenhouse energy effects—in this case on a scale proven to be desirable. The AR process happens to offer a unique way of spreading this energy effect to places that would otherwise have temperatures too low for the survival of life as we know it during the current era. Too much of this energy is also a possibility, of course, and would be troublesome.
Carl