This is good day to look at imagery. We’ll see another clear example of the relationship between atmospheric rivers (ARs), the total amount of precipitable water (PW) above any given surface location, and the temperature anomaly for the day affecting the chosen surface. The scene is southern Russia, latitude around 55 degrees, near Lake Baikal. Use 200% magnification for best closeup viewing. The first image shows a high and wide volume of PW entering eastern Russia from the south. High volume areas of PW that stand out earmark the dimensions of an AR—that’s because every AR is composed of nothing but PW. (There is no other way to identify them except when they are actively engaged in forming clouds or shedding precipitation.) This river keeps being deformed by wind currents, which have stopped its northward progress and are sending most of the remnants straight off to the east, for another stoppage at the Lake Baikal area. From there the very last of the remnants are shunted off to the north and south, still visible in diminished tones of gray.
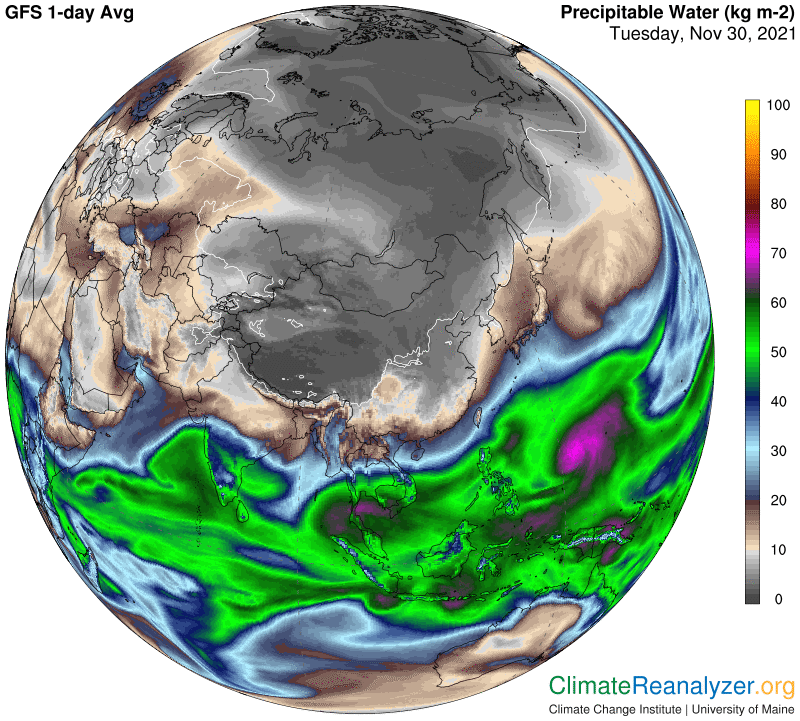
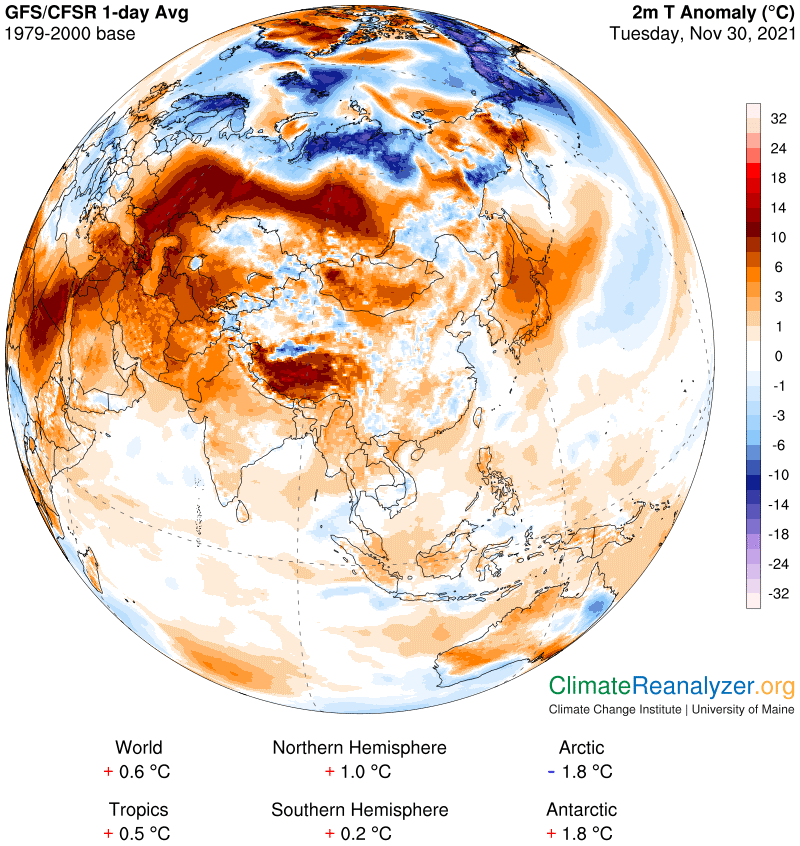
The volume of PW carried by this river keeps declining as the AR progresses to the east. Even after numerous reductions the amount of volume being carried is considerably greater than the normal volume of PW, mostly just vapor, that prevails immediately above a surface when no river is passing overhead. Because of PW’s total greenhouse energy effect (which science may some day recognize) the extra volume on this day is large enough to cause warm temperature anomalies of around 12-14C all the way to the AR stopping point near Lake Baikal. Surface humidity by itself is known to be naturally low at this time of year in central Asia. The concentrated boost from the AR that is high above, while only temporary, may thus be enough to more than double the total amount of PW content in the full column of air directly above any underlying location. That’s the basic explanation behind all the different large anomalies on the map, including the cold ones where no AR is in progress.
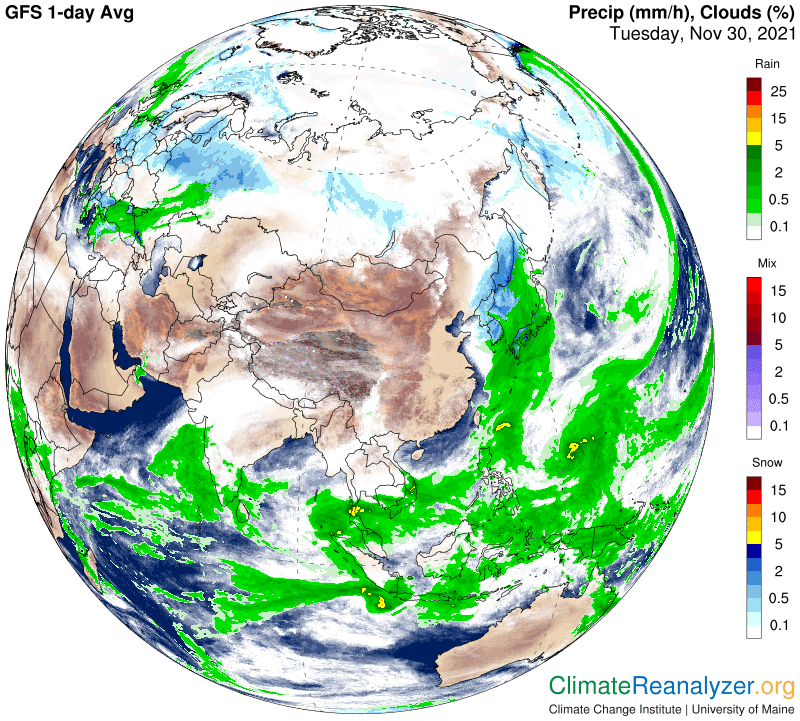
We’ll look at some data below, but first I want to provide additional evidence that the first image, which shows nothing other than differences in PW values, really does represent an active AR. What else, other than an AR, could be the source of all the precipitation we see on this or any other upper-latitude map? All ARs have to shed their PW content sooner or later, which is the main instrumental proof of their existence.
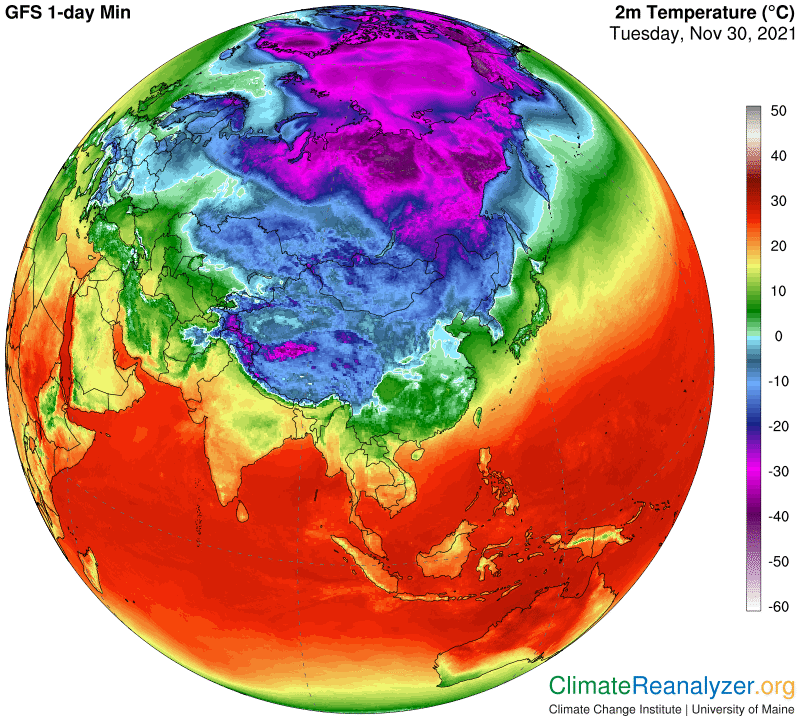
I also want to show what the temperature effects of an AR look like on current thermometers, not just on anomaly maps. Use the scale on the right to see how the temperatures below the rivers differ from those in nearby areas where the content of total PW in the atmosphere overhead is much lower. For example, I can pick out an area near the end of the AR with an average temperature just below 0C, not far to the west of Lake Baikal, and another area with readings of -30C only a few hundred miles off to the east that the AR failed to reach. (Be sure to magnify the image.)
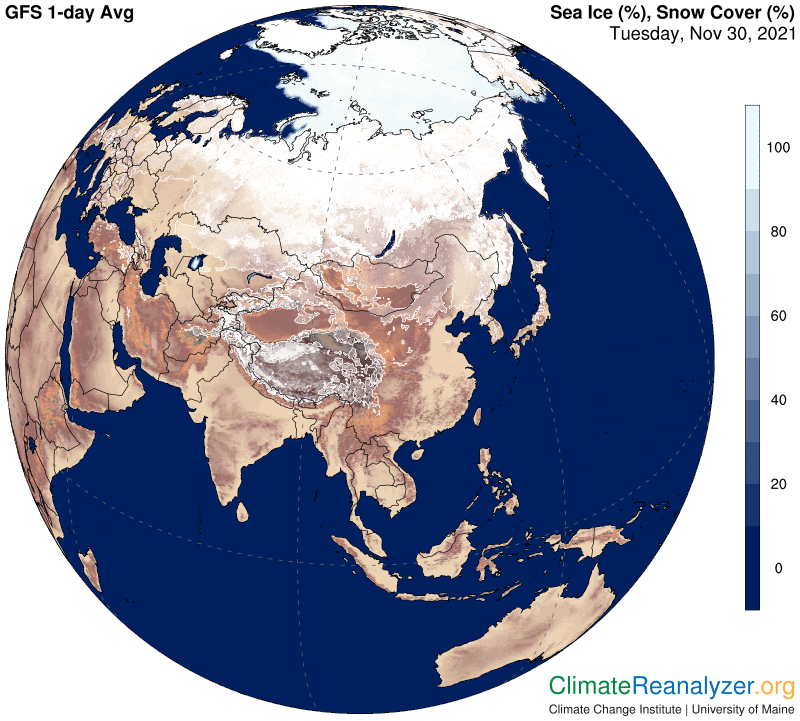
This map is a good one to use for checking out differences in both snow cover and surface elevation in any of areas examined. These things, if irregular, can also have an effect of a few degrees on daily temperatures and anomalies.
Now let’s put some key PW values under the microscope, where they can be compared with both anomalies and average temperatures for the same location. Just to the east of the top end of the lake average PW values at and above 6kg are common on this day. Not far to the west they quickly decline to ranges just above 2kg and then down to between 1 and 2kg. The temperature difference that we saw earlier averages around 25C across that interval and the combined anomaly shift, warm to cold, reaches a little more than 20C. The logarithmic rule must always be applied to PW comparisons, because that is how all greenhouse energy effects work, and PW needs to be recognized as a genuine producer of greenhouse effects, just like the gases but much quicker coming and going and much stronger. In this situation two doubles and a bit more are in sight relative to these locations, along with temperature anomalies that easily amount to 10C for each double. The areas of comparison are very closely related, but not quite exactly, in almost all respects. On most days they would show practically no difference in any of these measures. Today is all about an AR and its movement, and the PW it is composed of, minding its own business, way up high in the sky.
Carl