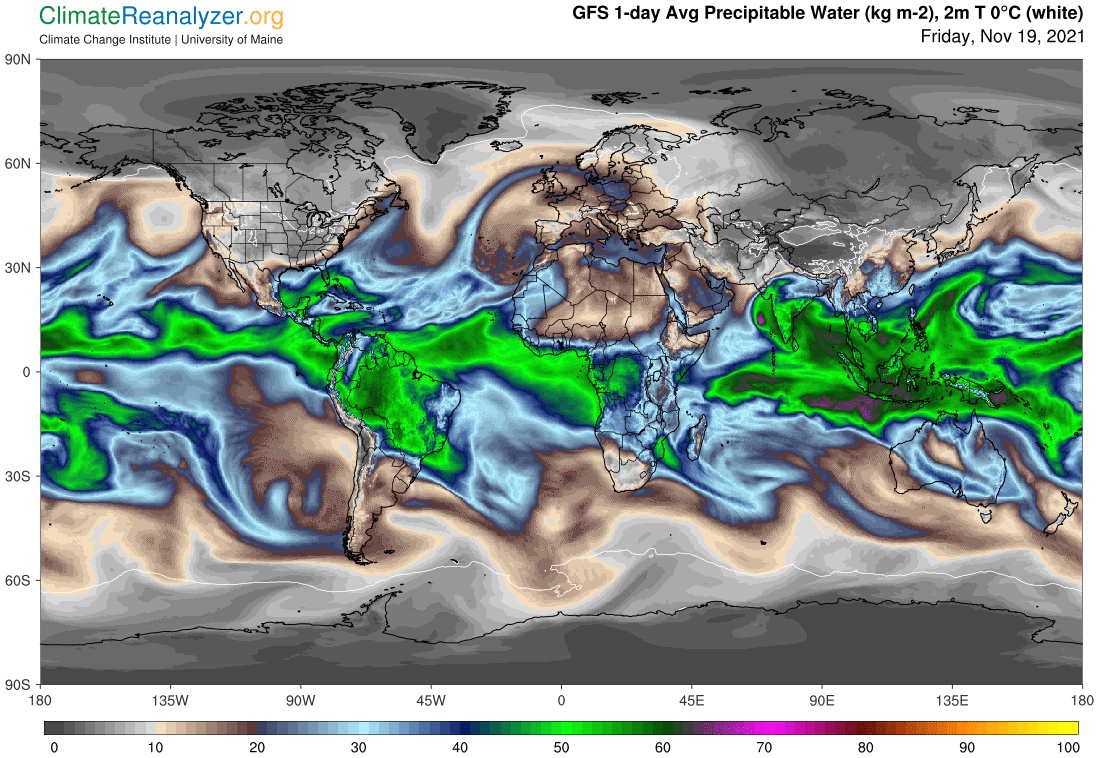
The best way to gain a full appreciation of the life cycle of an atmospheric river (AR) is by opening the 5-day animation website dedicated to total precipitable water (PW) content of the atmosphere: http://tropic.ssec.wisc.edu/real-time/mtpw2/product.php. If you can act on this today you can still pick up the event as it struck British Columbia a few days ago, and then see how quickly it moved on down the coast. In terms of total PW content this AR does not look any stronger than numerous others that have been progressing over the same time span in the two hemispheres. This site has nothing to show related to either rainfall or greenhouse energy effects. For that kind of relationship one must switch over to the weather maps at https://climatereanalyzer.org/wx/DailySummary/#t2, where only the very latest information is available. The PW animation also has no way of showing any kind of differences that may be occurring in the concentration and movement of PW content at different altitudes in each hemisphere outside of the tropical belt, nor do the weather maps have any such imagery to offer. At least there are a few visual clues that help to support other sources of relevant information about inevitable differences.
An understanding of the way the troposphere is divided by two separate wind systems is of key importance to anyone seeking to gain knowledge about how ARs form and operate. There is no such separation inside the tropical belt, which has only one wind system. Zonal imagery offers no sign of the kind of jetstream winds that are fundamental to the existence of a second wind system. Creation of a new and different system requires the initial formation of air pressure differentials that are combined into a pattern that is distinctly different from the pattern that exists at the surface. Natural forces actually do create entirely new patterns in each of the hemispheres. These patterns are visualized in the daily weather maps, under the heading of “500hPa Geopot. Height.” (See CL#2067 for examples.) The revised patterns effectively cover all of the horizontal area between 15 or 20 degrees of latitude up to each pole and vertical depth starting at about three miles of altitude to the top of the troposphere. Under the governance of a whole new set of pressure differentials this area is all transformed into jet stream territory. Air currents from the outside are able to enter and exit these new wind systems, possibly only in accordance with certain rules that are not readily describable. What I can describe and illustrate is the imagery surrounding the distinct and very special entry points of the limited number of discrete ARs that show up sequentially in the animation site. You can also pick the entry points out as they are beginning today on the following map full of snapshots of entire rivers in their current state of progress. The animated site reveals all of the rapid and remarkable changes that developed along the road to getting to where they are now.
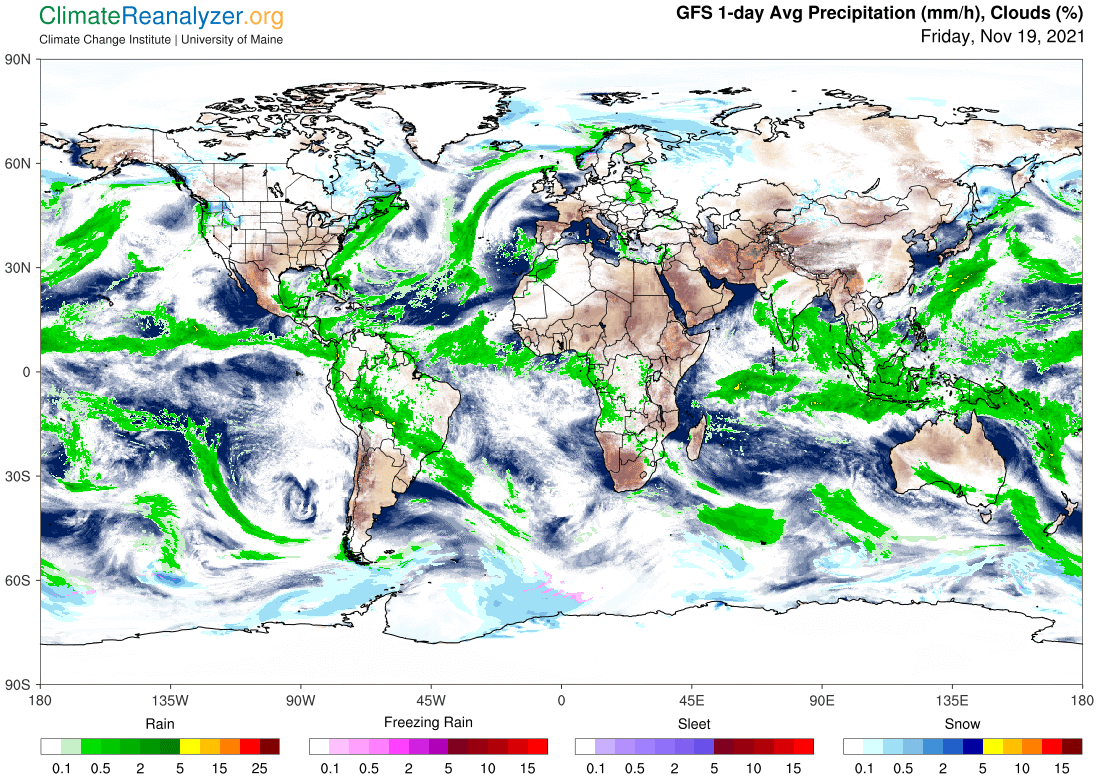
It is not unusual for an AR to dump most of its precipitation into open ocean water rather than on continental land. Rainfall rates may be extremely heavy when they do so, but they seldom become newsworthy. This map illustrates a typical day of where the big rains that we never hear about come down:
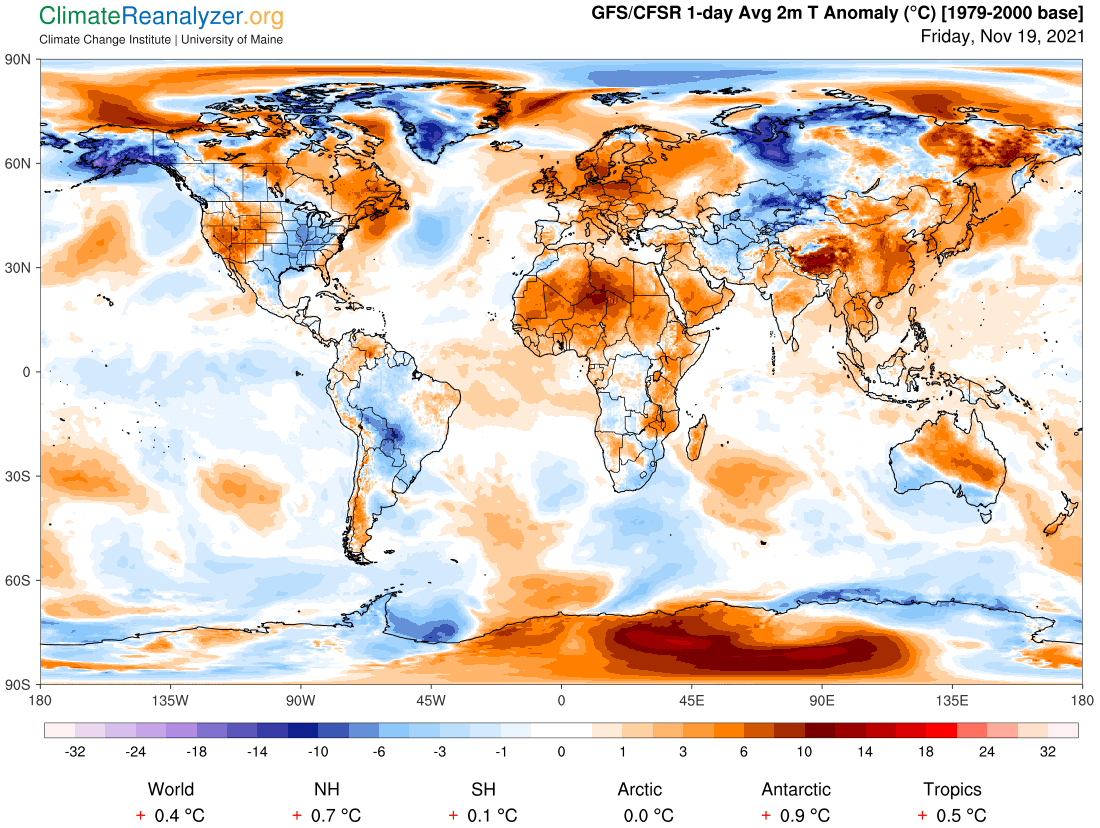
The greenhouse energy impact of the PW introduced into the upper atmosphere by the activity of ARs is quite unlike the distribution of precipitation impact. A large amount of this energy is actually collected by ocean surfaces but then fails to have much of an effect on air temperatures above those surfaces. Instead, much of what comes in is immediately conducted downward into deeper waters, where it is effectively stored for indefinitely long periods of time by a number of different processes that don’t exist on land. On land, nearly all incoming energy is very briefly stored in objects and layers close to the surface, ready for re-radiation into the atmosphere after a quick visitation. Also, little bits and fragments that erode off the edges of an AR are able to steadily maintain their individual greenhouse powers, as opposed to capacities that are needed for precipitation, as they spread out over land surfaces. Even the smallest of collections may be powerful enough to have an impact on surfaces below that have relatively low ambient levels of humidity. This map shows how warm anomalies on the continents tend to form over broad areas in and around the passage of an AR, depicted here in relation to the ARs in the map at the top:
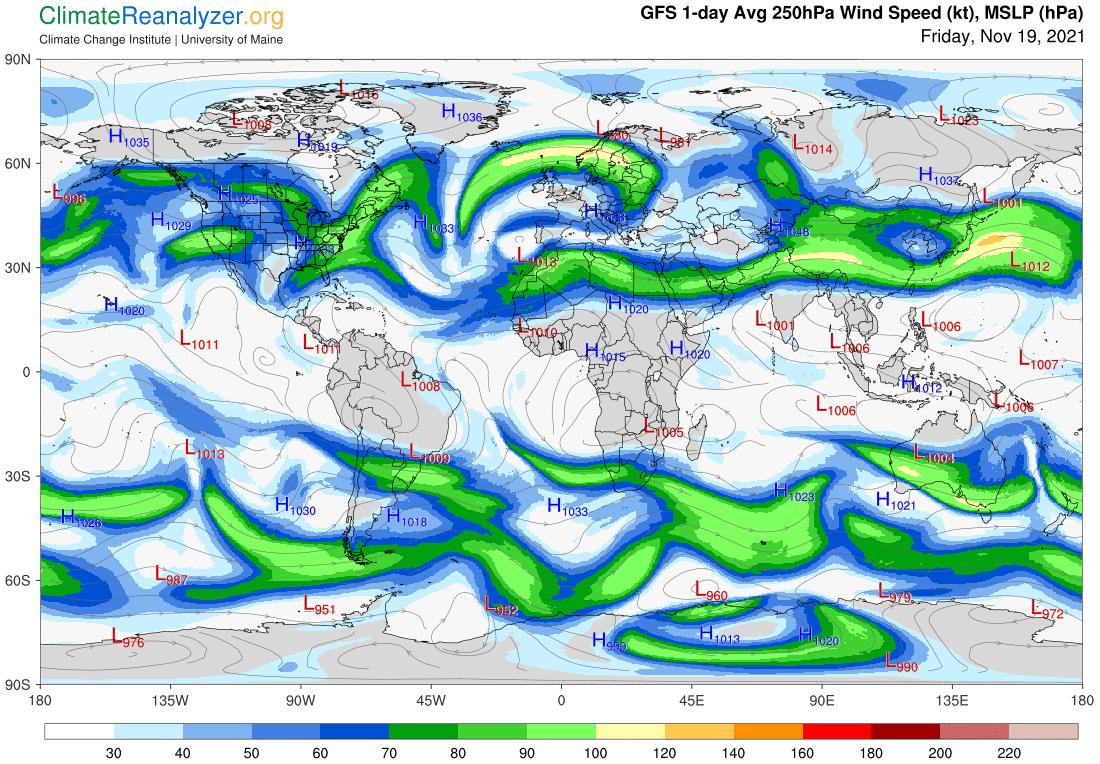
One more map is needed, showing what today’s jet stream activity looks like in each of the two hemispheres. As usual, there is nothing to show apart from minor rump-like movement within the tropical zone. Also as usual, the SH has a more robust and better organized congregation of jets than the NH, which makes it more difficult for ARs in the SH to continue their natural tendency to move contents into deeper sections of the polar zone. The distribution of greenhouse energy has fewer obstructions limiting their movement in the NH.
Carl