Researchers have developed a new methodology applicable to paleoclimate data for the purpose of detecting whether or not events known as “abrupt climate change” actually happened. I invite you to read a review of their published study at this link: https://phys.org/news/2021-11-climate-abruptly.html. Access to the full study is also available, showing details of the impressive effort behind the development of the methodology, by using the DOI at the end. It left me wondering why a similar amount of effort has never been devoted to the study of abrupt temperature changes that happen every day in some part of our current world—for example, changes of more than 40F from one day to the next, or more than 20C. We know they happen, but no one ever explains why, or how, in a convincing way. I have made an effort to do so myself, as described in these letters since early last year, using an unusual methodology that I had accidentally stumbled on to. The methodology is based on the discovery that certain concentrations of precipitable water (PW), carried at high altitude in discrete stream formations, possessed unrecognized greenhouse energy effects. These effects have unusual power due to the extraordinary levels of concentration of the PW in the streams. The powers are distributed in a random way over the mid-to-upper latitudes of both hemispheres, highly dependent on the behavior of the streams that carry them, (which are actually no different from those called atmospheric rivers), which in turn depends on the nature of existing wind currents that tend to govern the behavior of the streams. All of these discoveries were illuminated by imagery found every day at the Today’s Weather Maps website https://climatereanalyzer.org/wx/DailySummary/#t2 and fortified by continuous 5-day animation of PW streams at another website, http://tropic.ssec.wisc.edu/real-time/mtpw2/product.php.
This imagery is widely employed by meteorologists for studying precipitation events and other purposes, but not that I know of for any kind of fundamental study of greenhouse energy activity. Climate scientists, for whatever reasons, have taken no real interest in the causation of the even more abrupt changes, relative to those in the above study, in common everyday temperatures here and now. I think this is a mistake, because the monthly, yearly and decades-long anomalies that occupy their interest simply cannot occur unless there is some kind of evidence of underlying changes in daily temperature anomalies. The combination of all daily changes, both positive and negative, is what ends up as an accumulation that is signified by the results depicted in longer-term changes. If daily anomalies tend to be large, often dramatically so, abrupt in happenstance and growing more common, it seems inevitable that the accumulation of these anomalies will show up as special effects in the longer-term comparisons. This should be reason enough for engaging in deeper studies of whatever might be causing the daily disturbances. Simply knowing that abrupt changes of 40F or more are now happening somewhere almost every day, or that record heatwaves are popping up with regularity, should be reason enough for getting started.
What is the best way to start? I would suggest something very simple. Set up a few dozen locations, all on land and well away from the tropical belt, and start keeping daily records for each of them. The records must of course be topped off with basic temperature data, which is already being saved everywhere. Second, and this is where specific daily records are not in any habit of being kept, researchers must begin taking note of the average amounts of total PW in the overhead atmosphere for each location. This data is being collected by satellite instruments every few hours, with a great deal of accuracy. Get the numbers for every measurement if you can, otherwise the daily averages alone will be of great utility. Knowledge of the trending of total PW readings is absolutely essential, and is available for the asking. Just do it! Third, maintain descriptions of all the other things that are easy to keep track of, staring with cloud coverage throughout the day, snow cover, humidity, wind conditions, storm events and so on, meaning anything that could have some kind of effect on temperature readings large enough to be taken into a final account of changes for the day. The primary interest behind this activity is to come to an understanding of whether or not total PW readings should be evaluated and possibly taken into account just like everything else.
What I have been saying all along, through this weak and inconspicuous megaphone of a climate letter, is that a very tight relationship will be found between total PW readings and average temperatures, day after day, here, there and everywhere. It can be accounted for in no uncertain terms, by filling in the sizeable gaps that are often left open after everything else that can cause temperatures to change is known and accounted for. PW changes must be evaluated and accounted for logarithmically, based on an understanding that PW must have the same peculiar kind of “greenhouse” energy effect as all of the more regular greenhouse gases, including water vapor by itself. In the case of PW, according to what I see on the maps every day, a 100% gain in PW value from any level—which is quite common for a single day—will translate into an approximately 10C increase in temperature for a single given day at that locality. Testing the accuracy of this claim in real locations would not be a difficult project for any research team of trained scientists to undertake.
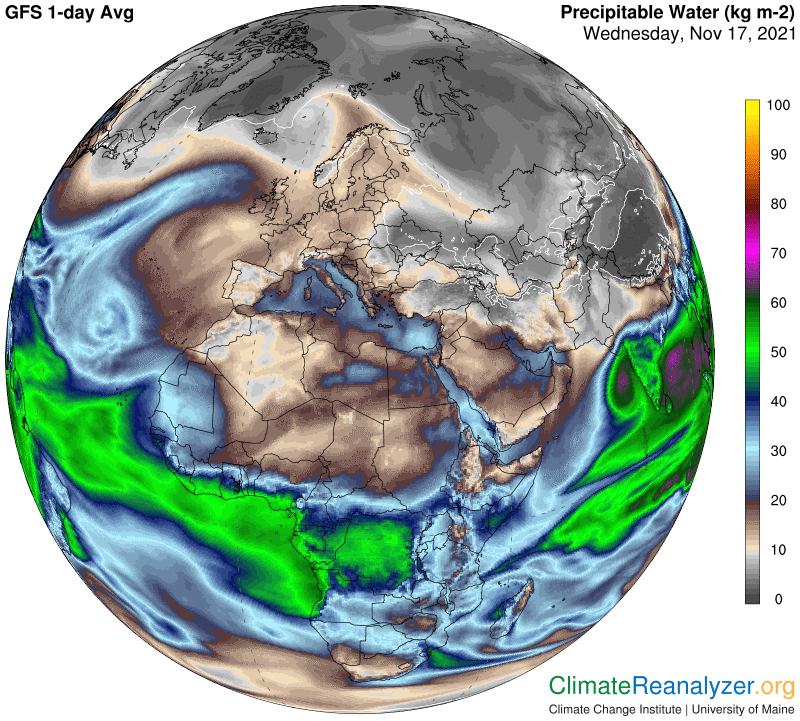
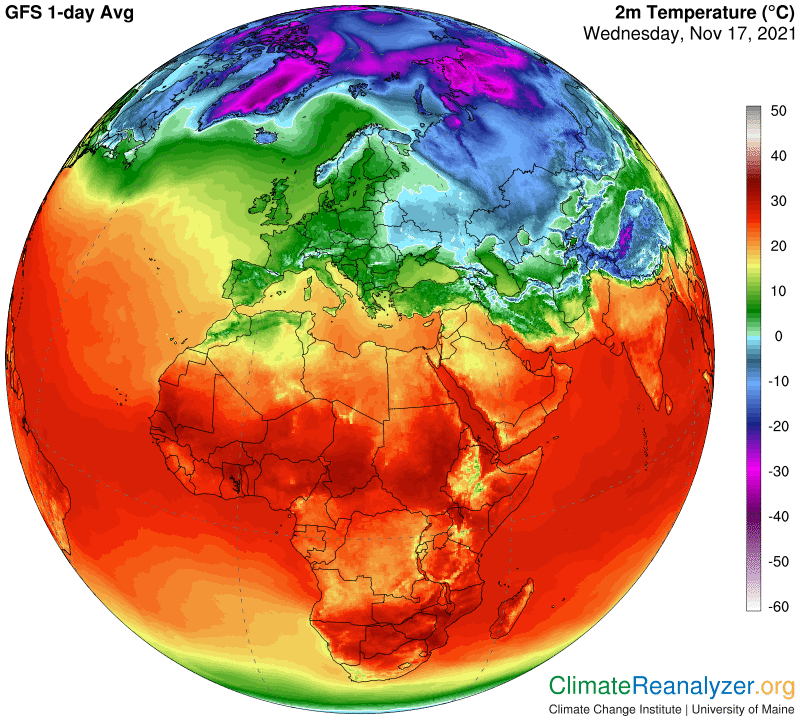
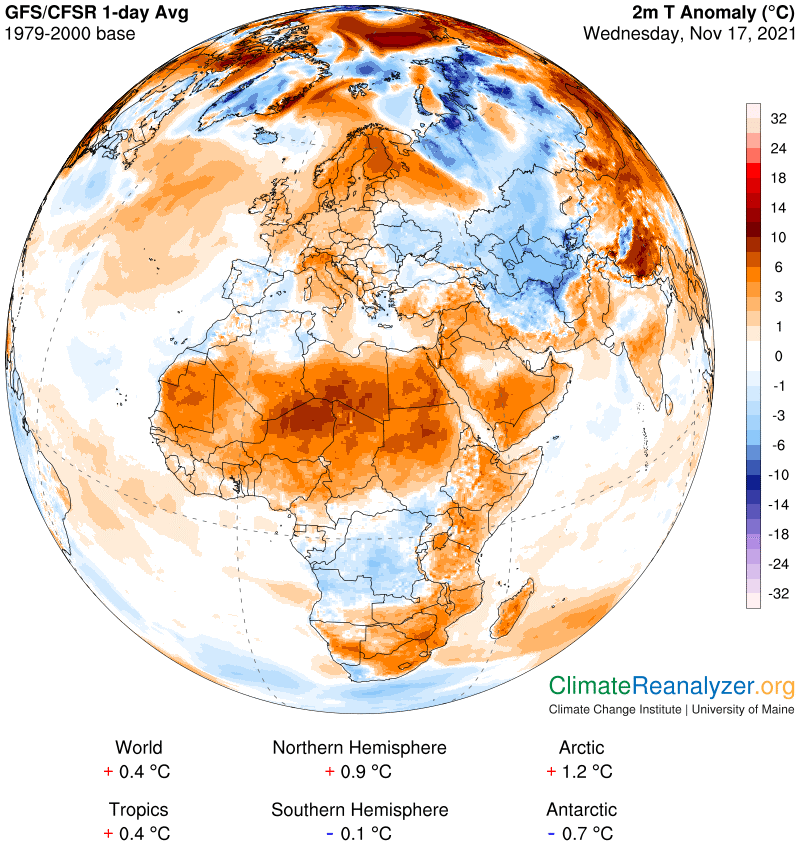
The next three maps will give you a rough idea of how this works, using several locations in close proximity on one day instead of one location over multiple days. Focus on the partial PW image in southern Russia shaped like the beak of a bird and compare its PW values to those in regions to the immediate north and south, with a main focus on the one to the north. Then do the same with average temperatures for the day in all three places on the second map, again focusing on comparisons immediately to the north, followed by a more vivid comparison of historical temperature anomalies as seen on the third map. The differences in PW values can explain why these temperatures in such close proximity are so different. Nothing else that one can think of as a normal source of causation should come anywhere near to being close. You wouldn’t know this about PW without first gathering all the data, which is easy enough, and then doing some hands-on research by making comparisons of this type, using any of several approaches. The research is also easy to perform for anyone willing to make the effort—and I will all but guarantee the results.
Carl