More analysis of Hansen’s July report. We’ll start with a close look at the goofy-looking chart that turns out to have a key role in his primary thesis. It’s all about a group of important “forcings,” in this case identified as a selection of greenhouse gases that have the power to change global surface temperatures in response to variability in their respective concentration in Earth’s atmosphere. These are all gases of the positive type and all fairly well-mixed, making them readily measurable in terms of watts per square meter. Note the contrasting scales on either side of the chart, based on the concept that every 1.0 w/sqm of incoming energy will consistently be translated into an estimated 0.75C in temperature change for each of the factors.
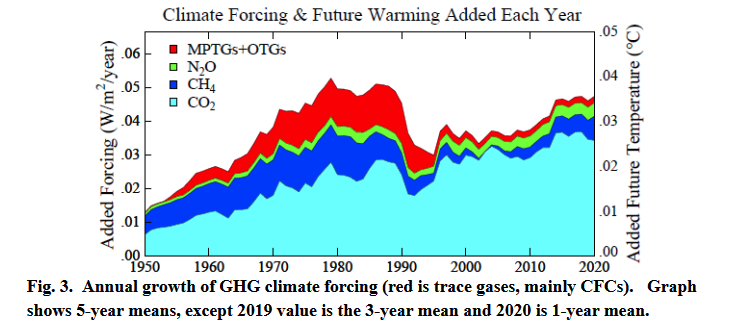
One family of gases, the basis of sulfate aerosols, that Hansen constantly refers to in recognition of the magnitude of their negative effects, does not appear on the chart, in part because their total cooling effect cannot be readily measured in w/sqm. Their distribution in the atmosphere is markedly uneven, and no instruments are in place that can accurately measure how much sunlight is actually blocked by the effects of their presence, which is mainly through interactions with clouds. Hansen has studied the issue in depth and knows it must be an unusually high amount, as suggested in several of his statements. Current values will be made available before long, but historical numbers from the days before these emissions were being actively cleaned up are probably out of reach.
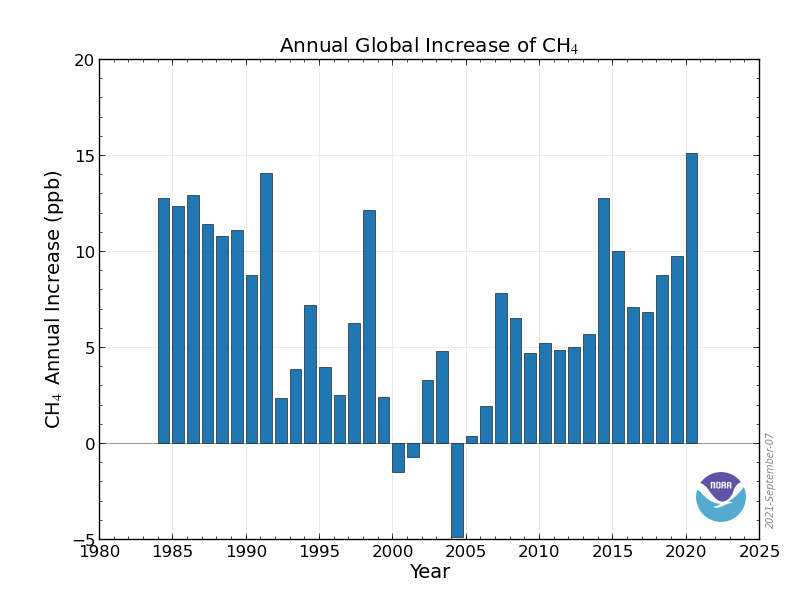
Next, we need to say a few words about the peculiar decline in the chart that occurred around 1990. Three major developments, all unrelated, unfolded at the same time by sheer coincidence, causing a total drop of about 2 w/sqm at one point. The decline in CFCs is easy to explain because of the massive cleanup effort that followed the Montreal Protocol of 1987. The causation of methane emissions (which are not related to any kind of output caused by the burning of natural gas) is often something of a mystery. They were recorded at the time on charts like this one, showing a trend of extraordinary fluctuation in airborne concentration occurrence.
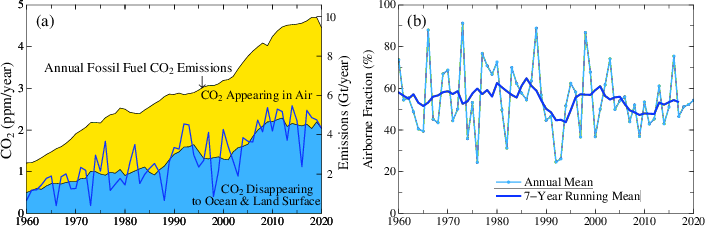
The sharp decline in CO2 around 1990 is the hardest to explain, because it had nothing to do with a drop in emissions. There was an enormous downward shift in the annual amount that remained in the atmosphere, which is where the greenhouse effect originates. It clearly shows up on the chart to the right. .The decline happened abruptly, for unexplained reasons, and has not fully recovered. We only know.the oceans were doing us a big favor by absorbing more of the stuff, and we can hope there is never a full comeback.
I need to say one more thing about the chart at the top, with reference to the amount of forcing attributed to one of the greenhouse gases, CO2. Hansen is simply doing what all other climate scientist do, day after day, when they assign the warming power of one other greenhouse gas, water vapor, in the form of an enlargement of the warming power of CO2. As a result the warming power of water vapor, which is the most potent of all the GHGs, is never depicted independently while that of CO2 by itself is approximately doubled after certain other feedbacks, having a somewhat more negative kind of effect, are also included. Science willingly treats water vapor and these others, in a physical sense, as nothing other than feedbacks of CO2 because of CO2’s high potency relative to that of methane and all of the lesser GHGs. These others, in fact, may in every case be stronger per molecule, but only because of their truly diminutive and often trace-like quantities. CO2’s strength is based on being far, far ahead of them all, including methane, in terms of quantity. For this latter reason Hansen himself commonly refers to CO2 as the “control knob” behind the total combination of almost all the different factors known to have an effect on surface temperatures. Water vapor gets added to the mix of things under the control of CO2 for a its own special set of reasons. I”ll have more to say about this tomorrow, with an interesting application to the Hansen report.
Carl