More than anything else, Carl’s theory relies on the discovery that total precipitable water (PW) concentrations in the atmosphere have a strong and consistent relationship with surface temperatures directly below. This applies best to any single location for any one day of the year, and has the same effect regardless of whether or not temperatures are also affected in other ways. When the PW concentration goes up, so does its contribution to temperatures. The effect is caused by an increase in radiative energy, which is at all times generated on a scale that is directly associated with the relative size of the PW concentration. The same thing can generally be said about solar energy, but in this case the energy is produced because of the workings of the greenhouse principle. (I do not believe these workings are limited to gases.) Everything that makes up the content of PW can both trap and emit longwave radiation, which is the very essence of what gives birth to the greenhouse principle.
The greenhouse energy effectiveness of PW can be tested by by matching single-day anomalies of PW concentrations with comparable anomalies of surface temperatures. The baseline periods of the anomalies should be the same for each, if at all possible. If not, we must rely on good judgment and plausible estimates. We have exact data for surface temperature anomalies all over the globe, and the same for current readings of PW values at every location, all readily available The anomaly for PW that we are in want of must still be estimated. For today’s letter we will be looking at a series of concentrated PW stream flows that are almost certainly anonamously high in energy power, enough so to produce consistently high warming effects on surfaces below their stronger points. Consistency is paramount if this type of analysis means anything.
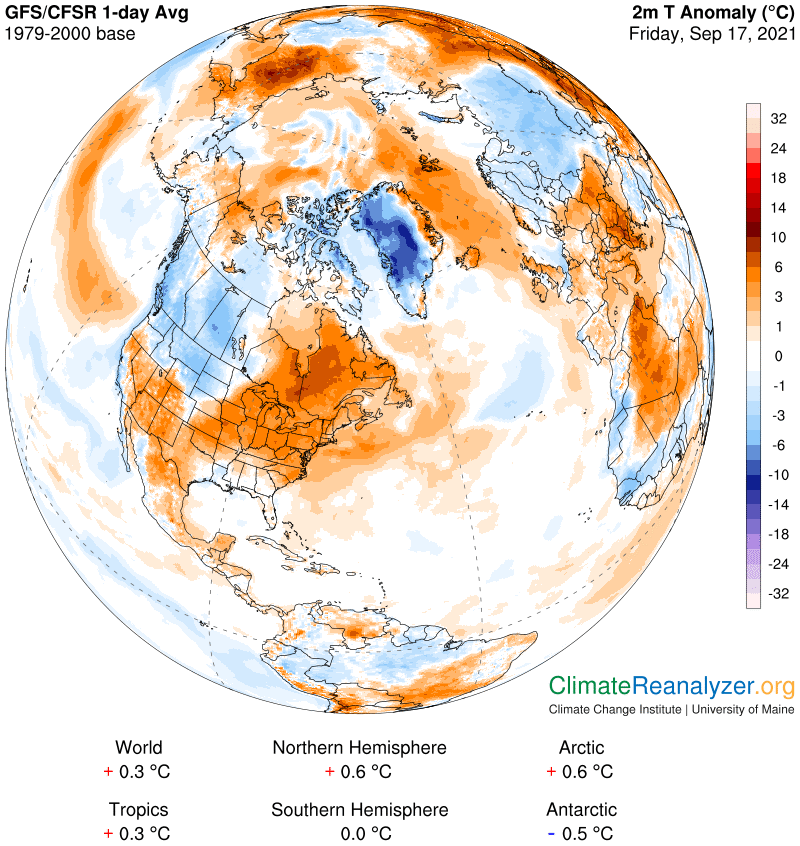
This first map depicts six PW streams that begin with concentrations of more than 30kg before tapering off as they flow northward. They should all be capable of producing warm anomalies along the surfaces that underlie their pathways, right up to any stopping point. The second map contains displays any anomalies that correspond to the positions of the streams. It is easy to follow the PW pathways and make the appropriate comparisons with quick visual interactions. My comments will follow.
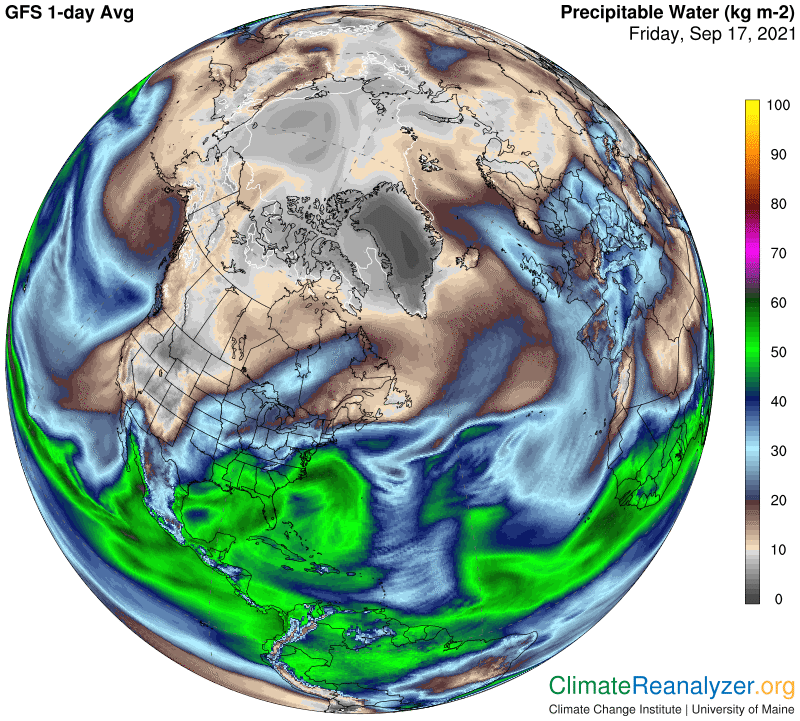
The first correspondence of the six, far to the left and over the Pacific, is almost perfect. The second, a tiny stream covering the Gulf of California, is an exception, I think because it depends entirely on the level of evaporation from waters within the Gulf, which tend to be very warm at this time of year. They could very well have been just as warm on an average day in the baseline period. (It looks that way on today’s SST Anomaly map, which appears near the end of the letter.) The third stream offers a very convincing example as it passes across the eastern US and into Canada. The fourth one fades away pretty quickly as it enters the Atlantic but does leave moderate tracks of warmth below over a wide area.
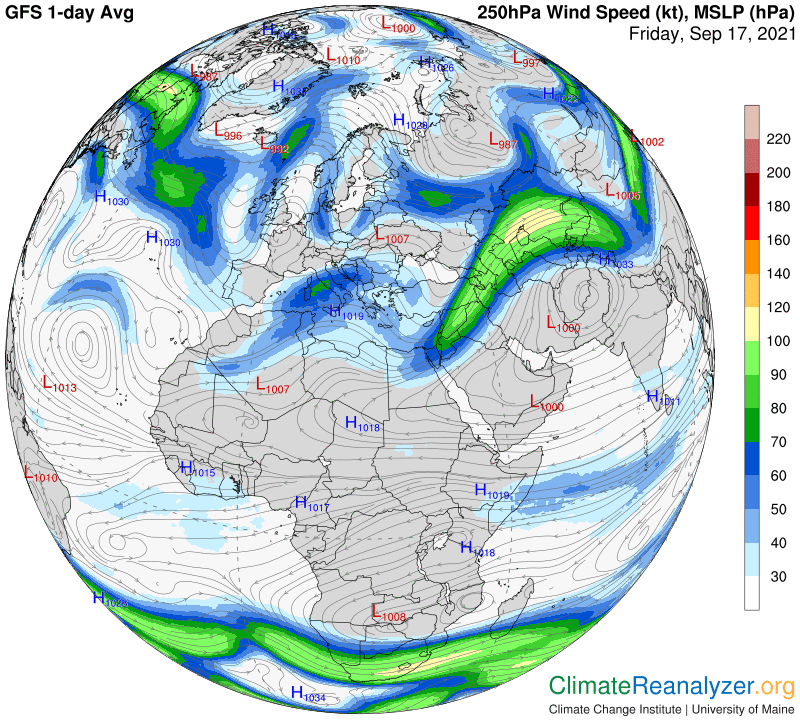
The fifth has a broad range of vapor accumulation in the central Atlantic that creates an anomaly early on in the “spikey” part and then again when the broad stream narrows down as it approaches Spain. The strongest effects are seen beyond the UK as it approaches and enters the polar zone, still holding relatively large concentrations of PW for any stream that holds together at latitudes so far north. See how close it comes to the pole at the end with a full 10kg of PW on tap. The final stream begins with a mix of sources that converge to the south of central Europe, with the power to produce plenty of warming. The stream comes to an abrupt stop when a strong jetstream wind crosses its path (see the last map below), creating a large area beyond that shows up, in the expected way, as a much drier and cooler region on the top two maps.
Gulf of California SST Anomaly:

Jetstream wind passing across central Europe:
Carl