Our planet’s most intense warming anomaly has a surprising source of heat. It’s been that way for several weeks now, and shows no signs of going away soon. The anomaly is in the central part of Asia, mostly in the Russian north. The worst readings are in the +10-14C range (about +20F) over a very large area. You can read about some of the damage it is doing in the form of extreme wildfires by going to this story: https://phys.org/news/2021-08-wildfires-russia-central-regions.html. Here it is on the map:
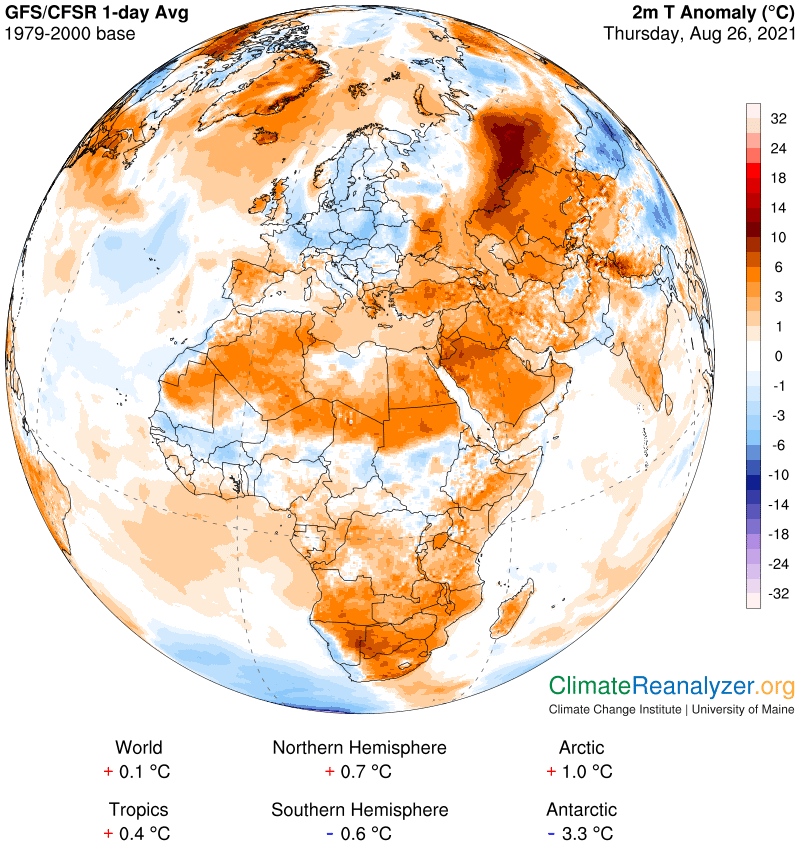
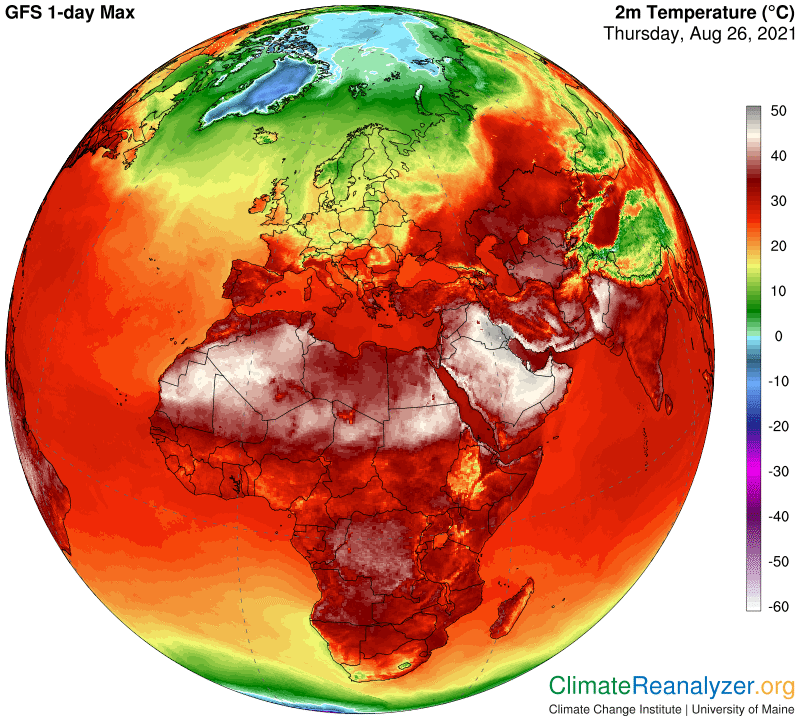
While we are here, notice the overall size of the nearly unbroken warm anomaly that runs all the way across northern Africa and up through central Asia, much of which is in a range of +3-5C. That’s a lot of heat when added on to maximum temperatures that were already sizzling hot, like 100F and more during the baseline period before the year 2000. This next map shows Iraq as the worst place of all, with maximums all the way up to about 117F in its well-populated southern region. The Indus valley in Pakistan is another densely populated hotspot on this map, day after day.
The immense area covered by the full-sized warm anomaly is in part the result of an equally large area of unbroken clear skies. Why such an absence of clouds and rain? It’s been that way for many days now. We’ll see on the map below this one that there is plenty of moisture in the sky that could be producing a few more showers here and there, maybe not in the dessert areas but at least in all that space more to the north, which is so different from nearby central Europe in this respect.
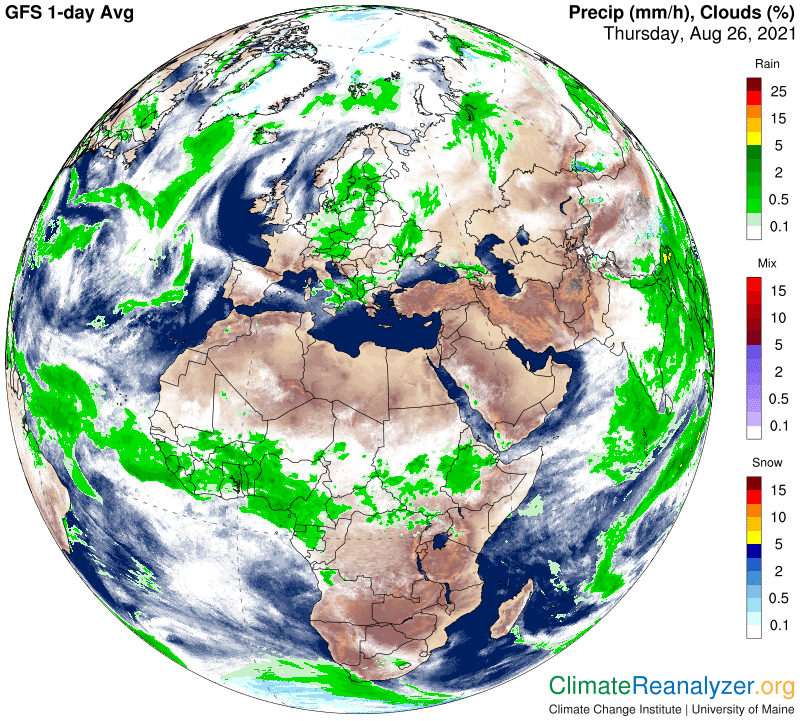
Let’s go to the precipitable water (PW) map to see why so many questions. There is simply no consistent relationship between high PW readings and rainfall propensity. Why shouldn’t the highest produce more rain? Substantial rainfall is the primary engine of capability for canceling out PW’s greenhouse energy effect that does so much damage when it goes unchecked.

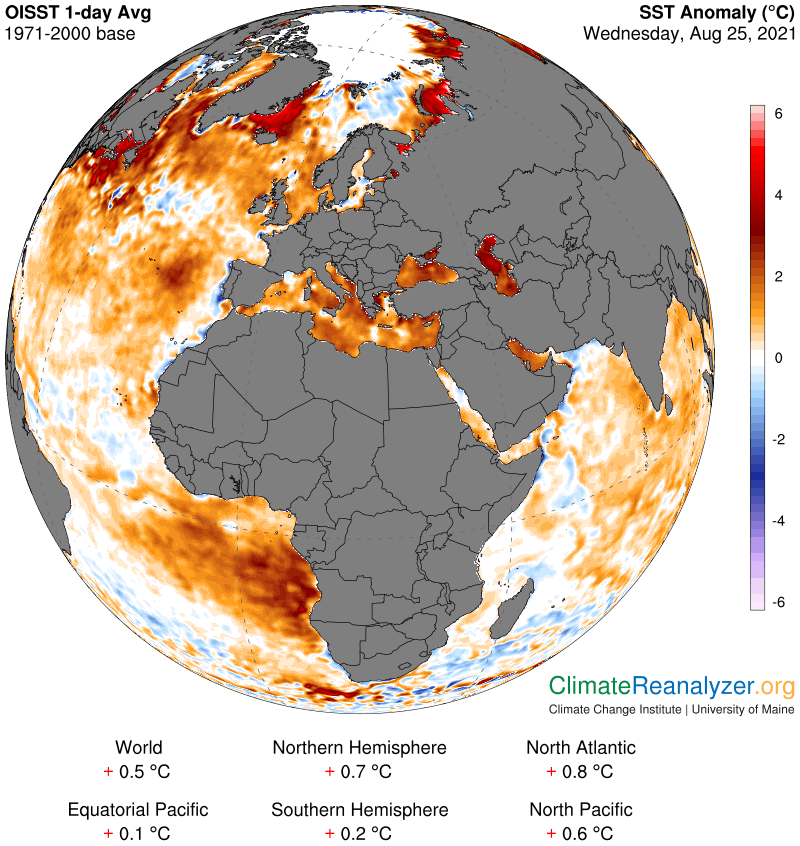
Now let’s go back to my original intent, which was to show the source of heat in the most intense anomaly region. I can’t see much of anything to blame other than the incredibly large amount of PW arising from a not-very-large body of water called the Caspian Sea. How can the Caspian be such a powerhouse? I think the answer is revealed by this next map, showing surface temperatures that are on par with most tropical standards. But—the northern half of this sea is at the same latitude as the state of Minnesota! A shallow sea can soak up and hold an enormous amount of energy. The Caspian still no match for the Persian Gulf, the evaporation from which translates into the heat source of the world’s highest temperatures in immediately surrounding territories.
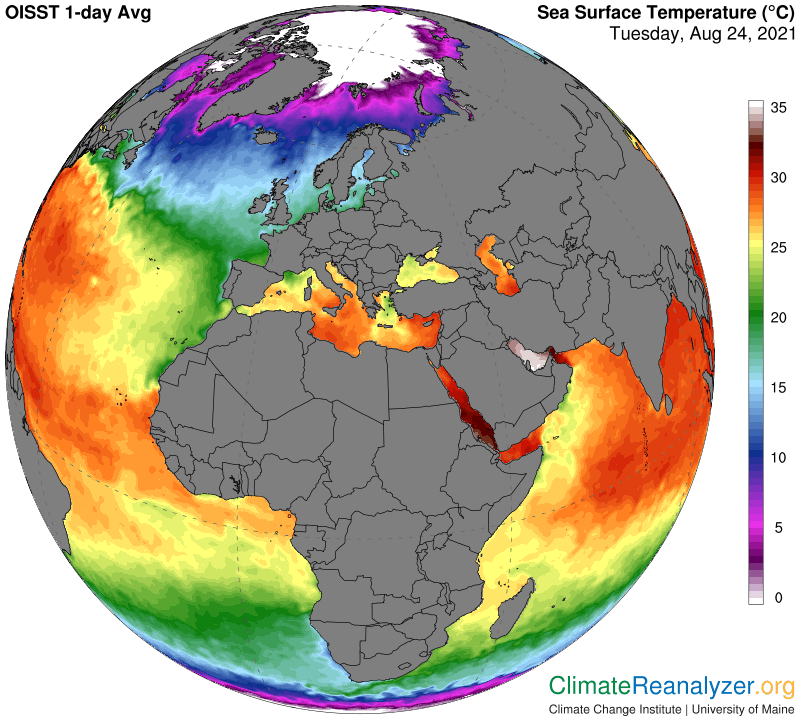
These two seas, the Mediterranean, and many of their neighbors have been warming for the last 30-40 years at rates averaging not much less than one degree C per decade. How long can this continue? Is there any limit? The Persian Gulf is not telling us there is a limit. Lastly, might this warming rate be accelerating? If so, it’s no fun thinking about the consequences.
Carl