All maps today. We want to see what is happening at the two poles. They are both getting ready to make the transition to a new deep season, with the old oneatill peaking. The south has had an exceptionally cold winter, way below the average from the late 20th century (today it’s -4.5C), so it’s really buttoned up. We’ll start with high-altitude air pressure, where the blue zone is as big and solid as you will ever see it:
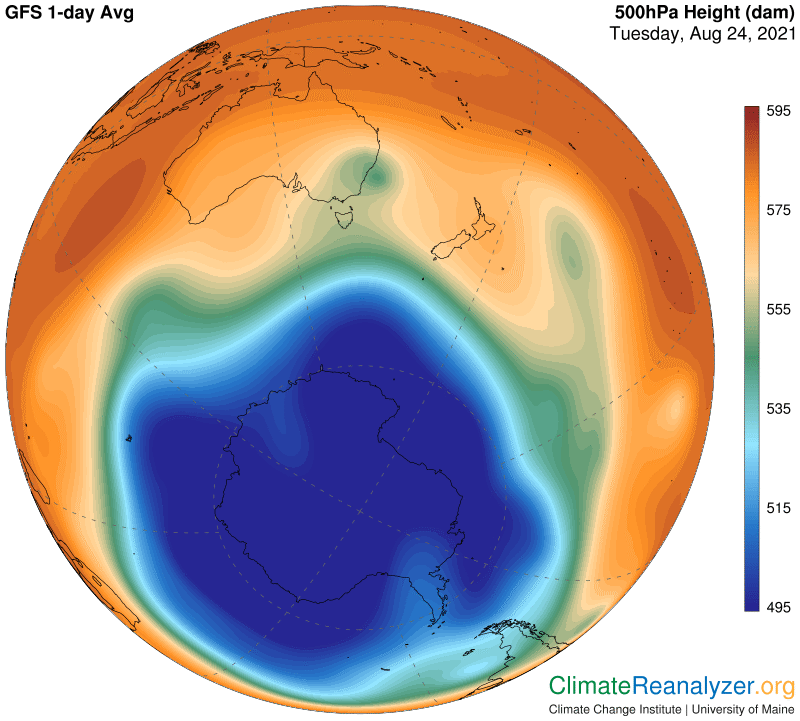
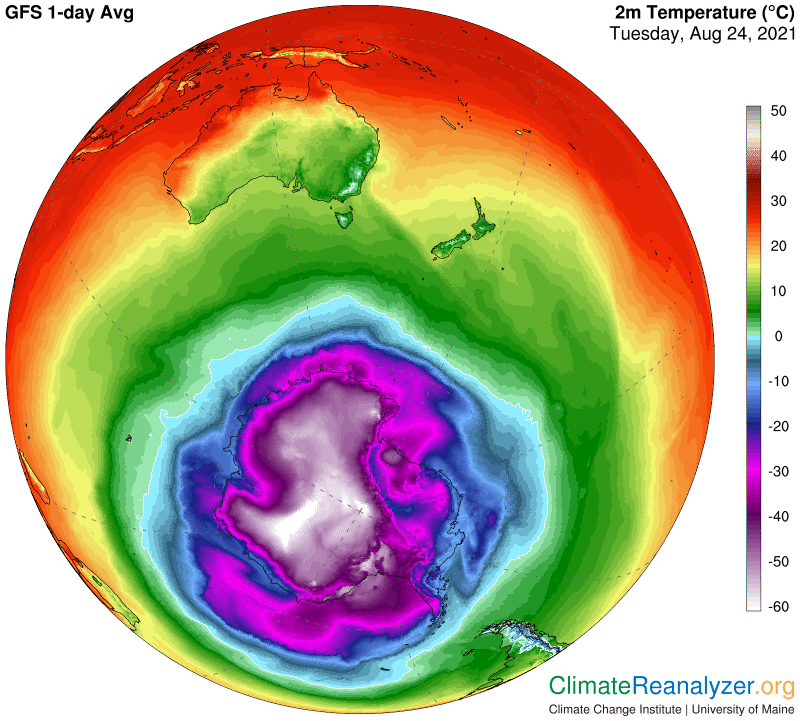
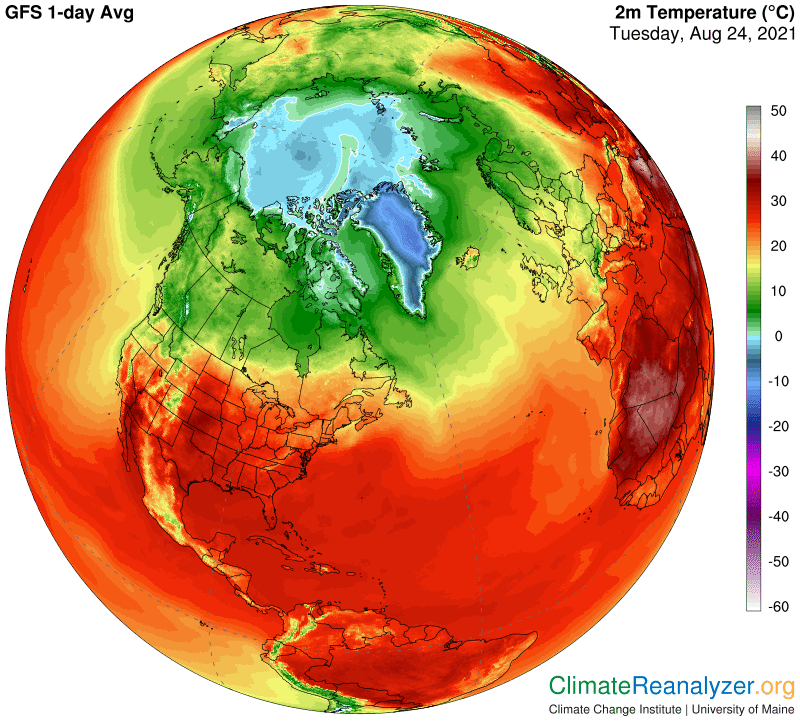
At 500 hPa (half the weight of the whole atmosphere) this image is more than three miles above the surface. The blue zone has nevertheless created an almost perfect match with the area of surface temperatures that are all below freezing, as we’ll see on the next map. It can’t actually read the temperature down there, but does react to weak upward pressures due to low thermal expansion of very cold air on the surface. There is not much room left for the green zone, which only reacts to upward pressure from air in about the rather narrow 0 to +10C range. Now for today’s-average temperature map:
The blue zone and green zone are each coded for pressure gradients at their outer perimeters that reflect the locations of important jetstream pathways. When the two pathways are this close together their winds tend to combine and become magnified in several places, with the following result—(The strong outer jet that you see is caused by a separate pair that lies within the 500 hPa red zone):
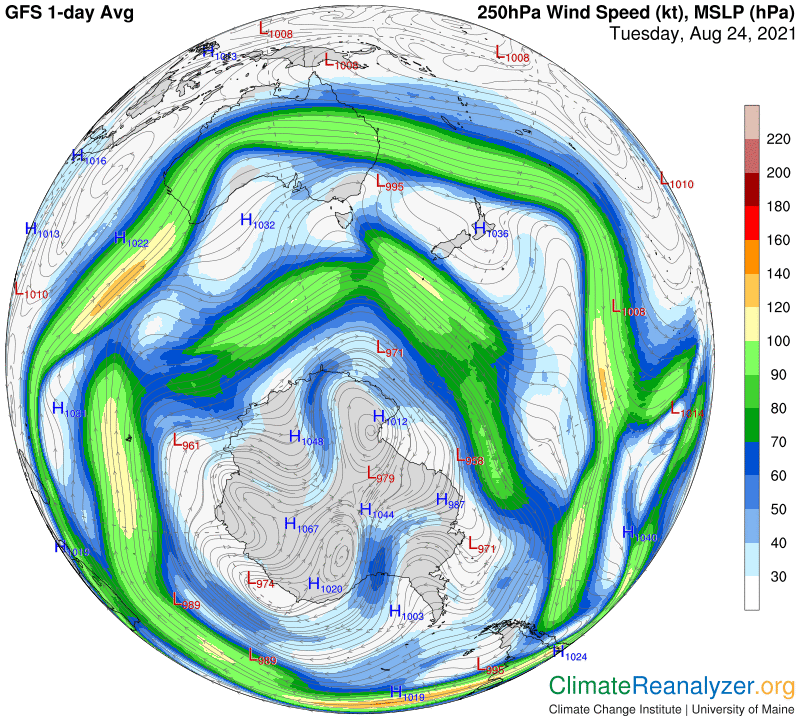
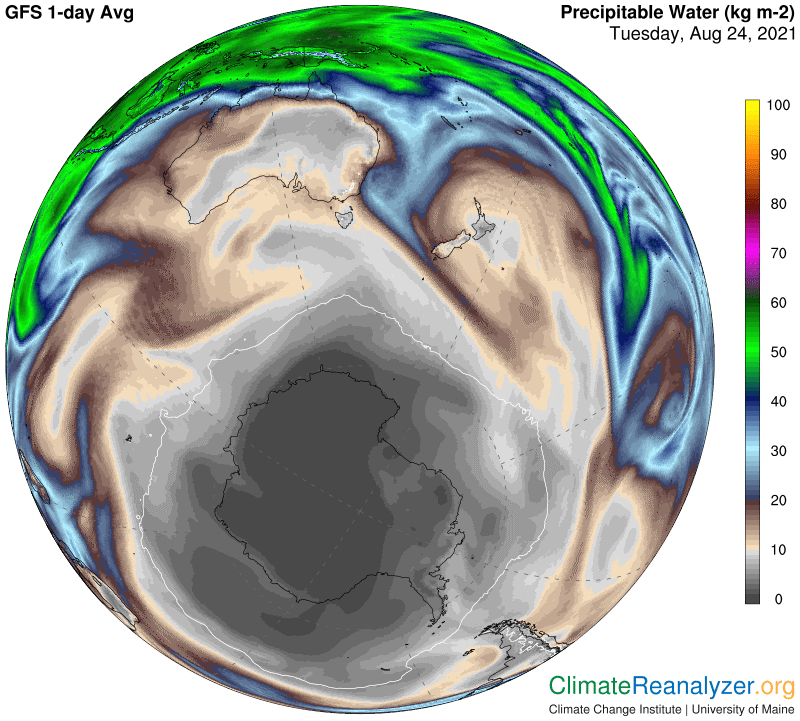
All of this strong and relatively unbroken wind activity is very effective at preventing streams of concentrated precipitable water (PW) from migrating very far into the polar region. The resulting lack of PW’s greenhouse energy capability provides a major reason for why everything is so cold down.at the surface. Note how really dry and cold the atmosphere is throughout the entire inside of the blue zone area:
Now we’ll switch over to the north for a look at the contrasts in the same imagery. See how tiny the blue zone is, leaving a green zone that is small in size but all spread out and in a state of disarray:
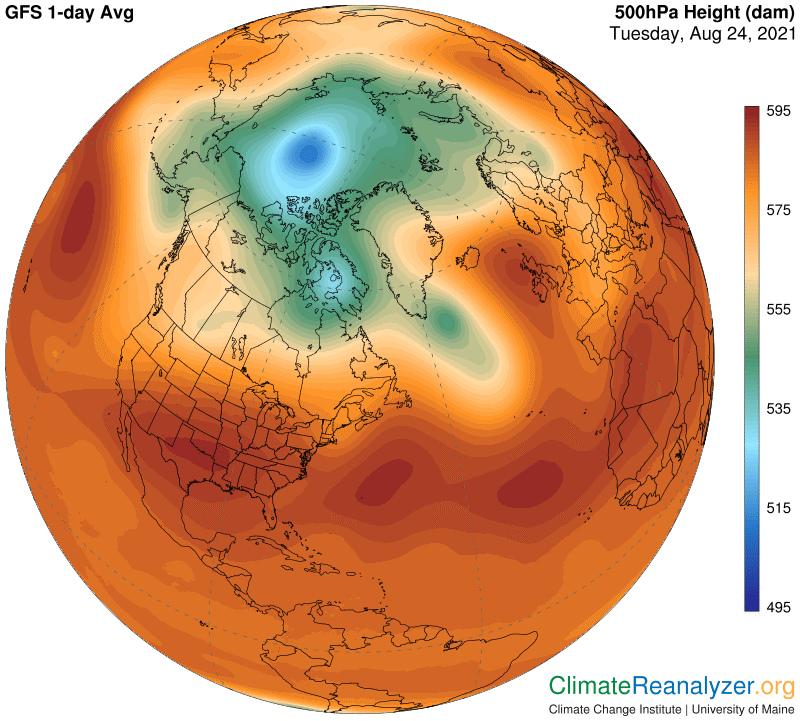
The blue zone is located exactly where it belongs, positioned directly over the one small area that measures a couple of degrees below freezing on this next map. The green zone has trouble figuring out where its perimeter belongs, because temperatures between zero and the low ‘teens are so scrambled. Air pressures rising from the mix of surrounding ocean water temperatures add to the confusion in setting up the high-level pressure pattern that results:
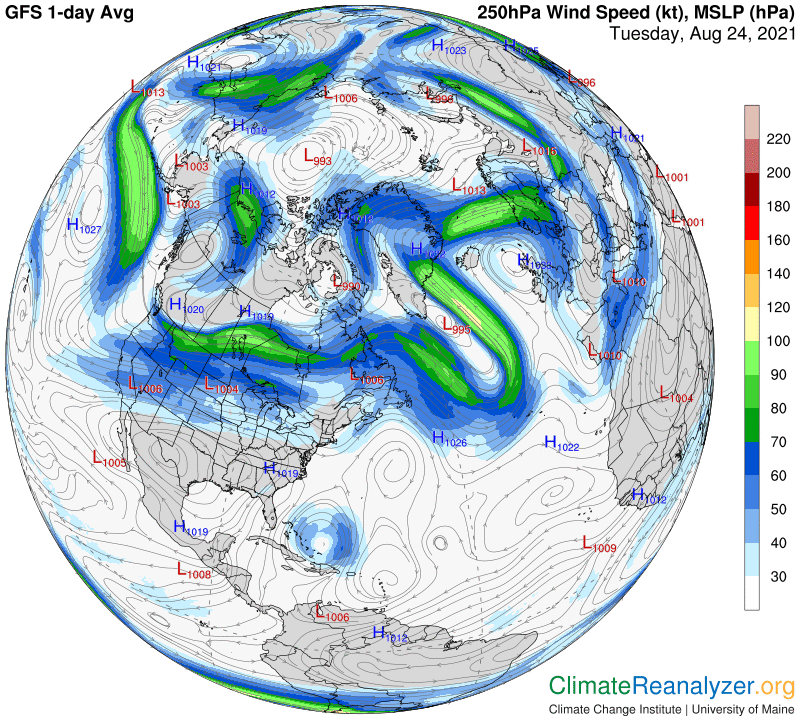
Under these circumstances jetstream pathways have all kinds of trouble getting organized, which means their winds don’t have much in the way of a secure home. The blue zone perimeter has isobars in place but no wind, while the green zone is left weak and patchy. Red-zone winds suffer from too many sharp convolutions in the pressure pattern. Compare the features in this overall picture with those in the one above:
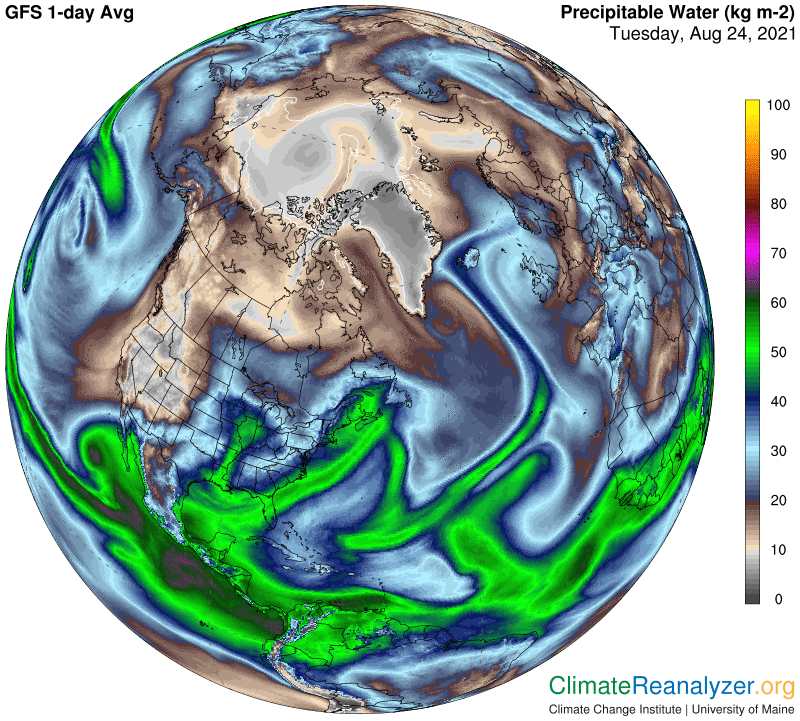
This leaves us with a PW map full of concentrations that have made an easy entry into the polar zone. The pole itself has been overrun and bears an anomaly of several degrees. Two nearby spots have managed to stay clear and cold, including the one that supports the formation of the incipient blue zone.
Six months from now both of these regions will have completed a total seasonal reversal. I predict that none of these images will come close to matching those now seen on the other side. Current trends in their patterns of change are just too well entrenched by the way energy is stored in their various subsurface locations.
Carl