Today’s letter will be mostly about images. This set, from central Asia, does a beautiful job of illustrating the connection between surface air temperatures and events that are only realized in the upper part of the atmosphere, starting at an altitude about three or four miles above the surface. The end result connects the greenhouse energy production of high precipitable water (PW) concentrations in the upper atmosphere to surface air temperatures in such a way that each has a positive feedback effect on the other. By doing so I believe all of the participants tend to stay in place for a longer-than-usual amount of time, instead of moving eastward in a more usual way, which helps to explain why heatwaves tend to have such long duration. To start this journey, focus on the shape and location of the large warm anomaly in central Siberia:
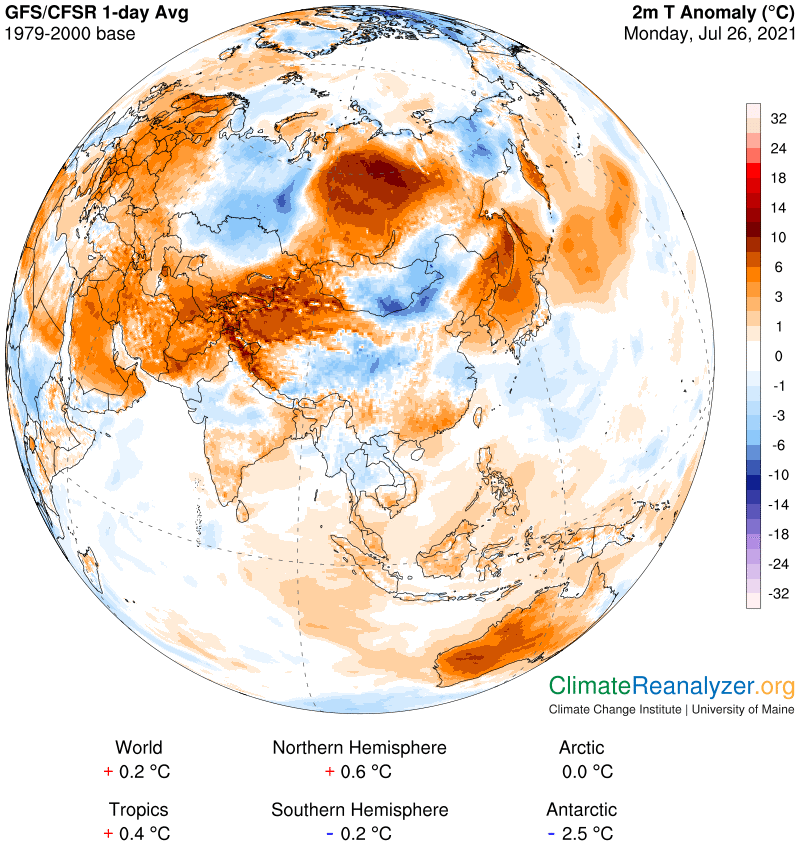
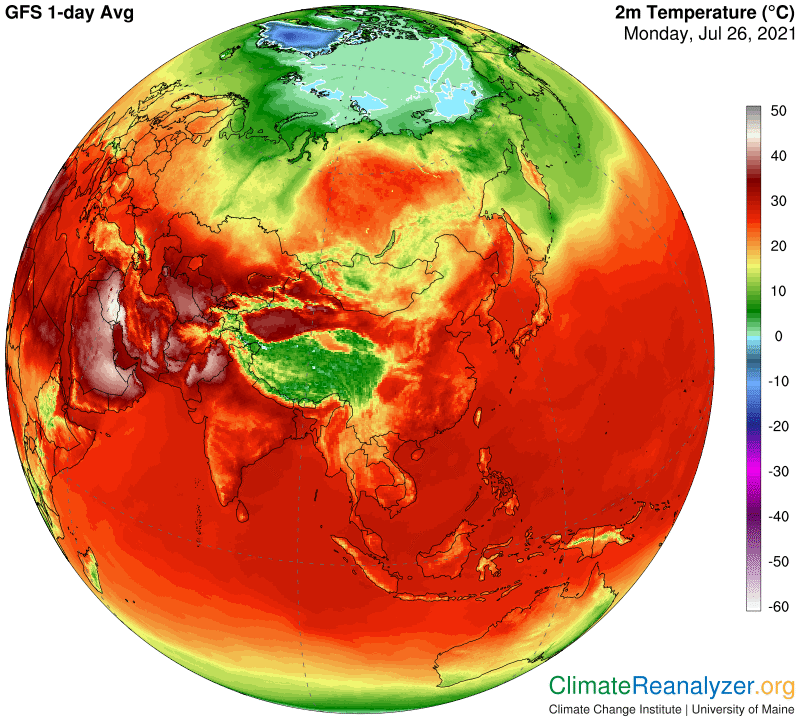
Here are the surface temperature averages that can account for the warm anomaly and the cooler ones that appear on all sides. There must be reasons for such big differences:
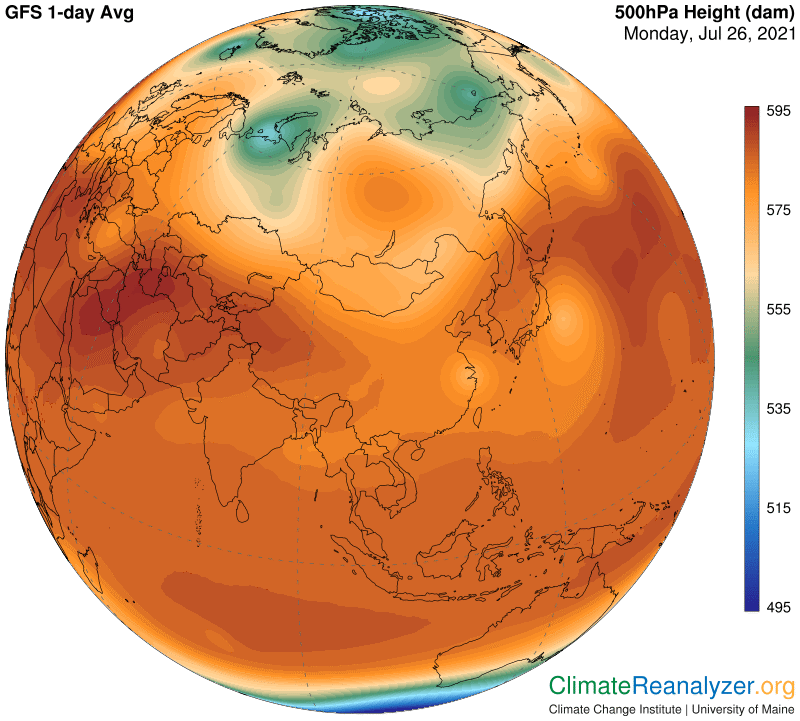
Carl’s theory is based on findings that surfaces temperatures have an enormous influence on the pattern of air pressure differentials—as seen below—that only complete the process of taking their final shape when the level of higher altitude has been gained. The only good reason for this that I can think of is dependent on how the rate of thermal expansion of air masses at the surface is linked to temperature differences. Because warm air is less dense than cold it must have more of an “upward push” on the air masses higher up, which are generally cooler and also more uniform in temperature.
As illustrated many times in previous letters, this configuration of air pressure differentials, as also expressed by means of isobars, has literally a governing effect on the positioning of major jetstream pathways. It also provides many of the reasons for variation in wind strength along those paths. Today is no exception. You can even see how a pressure center that formed in the middle part of the warm air zone was able to develop its own full circle of isobars. Note the two little fingerling jets that have found a pathway to call home along those isobars:
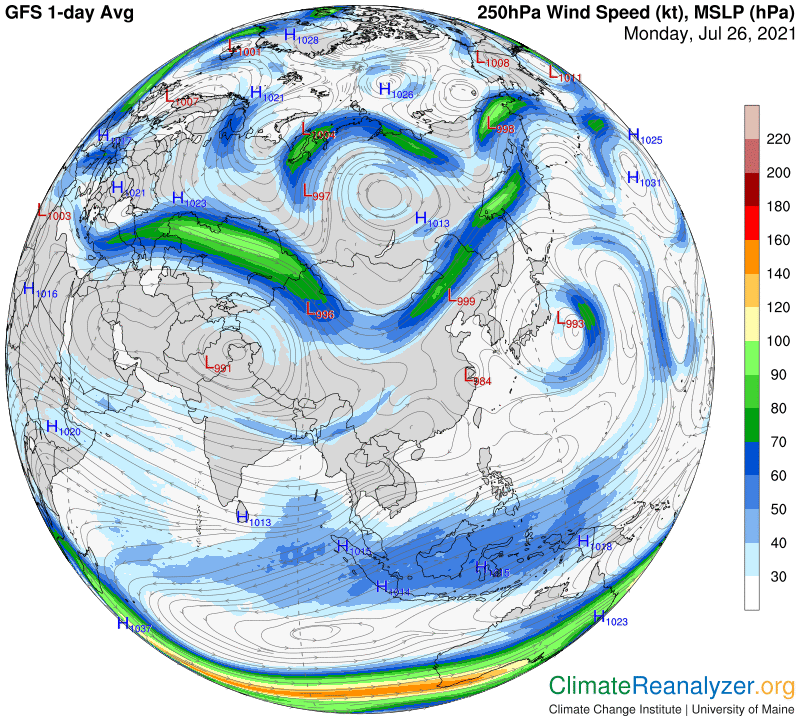
Some jetstream winds are positioned in a way that makes them effective as high-volume carriers of PW concentrations, especially when angling northward in the NH. This image shows us exactly how this has happened on the stream that follows the perimeter of the “green zone” on the air pressure map. See how much of the PW it is carrying eventually escaped the wind stream on the north side, as well as within the more enclosed area, when the pathway bent around toward the south:
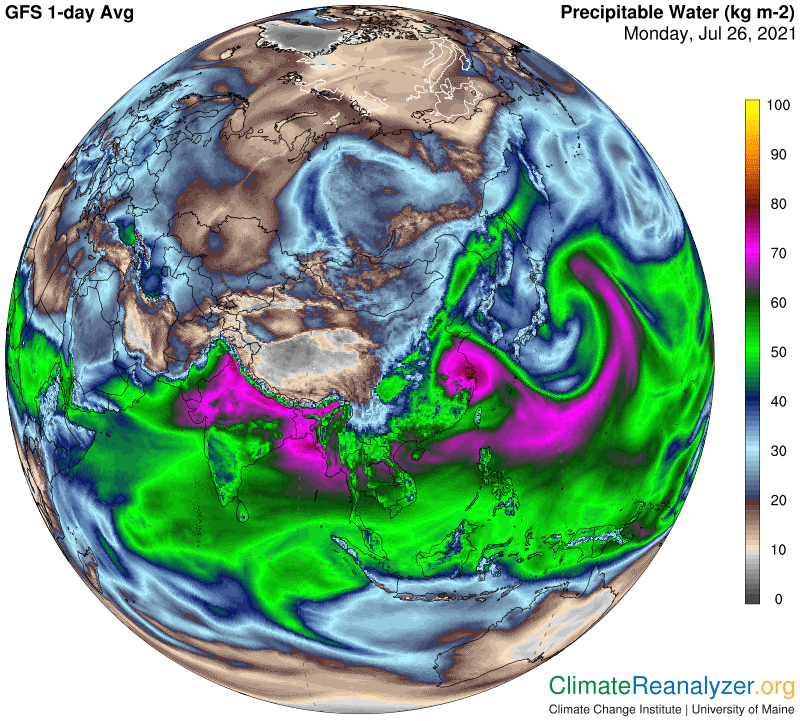
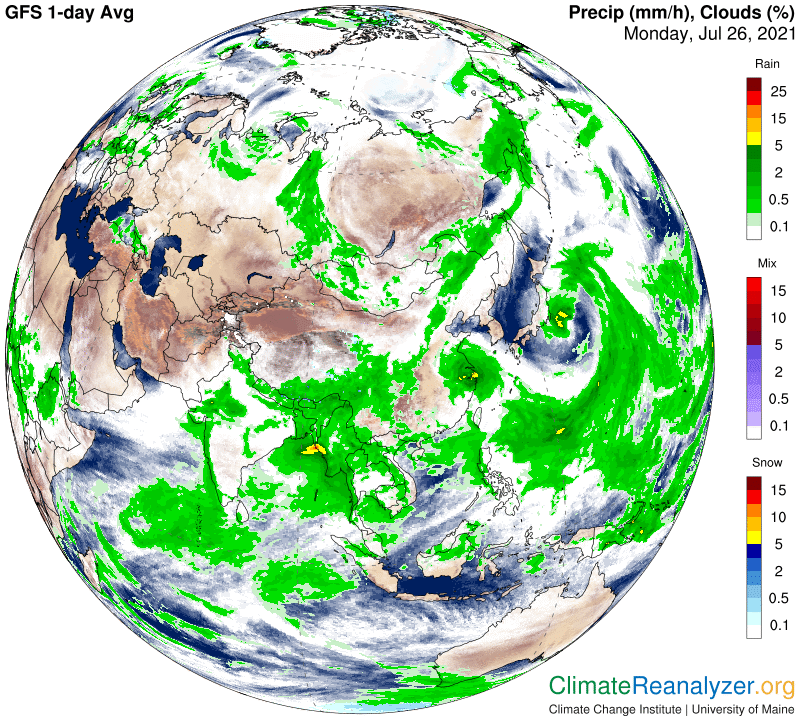
A final reckoning of the outcome, as observed in the very first image, cannot be made without gathering all the available information about cloud formation and heavy rainfall associated with the PW carried by this same particular jet wind. Their formation is not entirely consistent, but when they do form the resulting albedo cooling effect can be even more powerful than the greenhouse warming effect of the high PW load. The warm air anomaly zone has only a moderate PW content, still estimable as well above its historical average. The clear sky overhead probably adds a couple of degrees to the anomaly, just because an average day in the past would have had an average amount of cloud cover instead of a clear sky like the one we see today, thus causing its average temperature to be a bit lower from a relative perspective.
Carl