A year ago at this time I was showing images from the weather maps in order to illustrate various points being made while developing what today is called Carl’s theory. I now realize how valuable the images are when reconsidered as archives. Thanks to WordPress, going back to retrieve them can be done in a snap. Today I want to repost a couple of them from about this same date so we can search for year-to-year changes that could have a bearing on where the theory is headed. Developments to date have reached a point where the main challenge is to find something meaningful to say about the future, based on previously unexplored ideas related to the potential for expansion of the greenhouse powers of precipitable water (PW). Archiving of pertinent images, with appropriate commentary, will be a matter of high priority from here on.
Seasonal changes in upper-level air pressure configuration are of supreme importance in setting the stage for the kind of jetstream activity that restricts the freedom of movement of high-altitude PW stream concentrations. I assume most readers already know where these streams come from, where they are headed, and what kind of damage the PW can do when closing in on a common”goal” at the center of the polar zone if not stopped short of reaching it. Last year was a terrible year for “Arctic amplification” by way of temperature increases, and we saw how it developed over the summer as jetstream barriers withered away. I firmly believe that many past precedents were being broken, but don’t have the kind of recorded evidence needed to back up that belief. Now we can at least see how this year compares with 2020, starting with the changes in air pressure that govern the high level wind system in the troposphere. Here is how it looked a year ago in the north, as of June 12:

And here is how it looks today:

The overall shape of the green zone relative to North America is certainly of interest by itself. As for an overall comparison of features depicting the structural health of the two blue and green zones, I can only say that this year does not so far look any weaker, and may even be a little better than last, which is a good sign. There is also a jetstream map in the earlier letter but the imagery being used at the time was antiquated and just does not compare properly with today’s. We can still show how the temperature anomaly maps compare for these two dates:
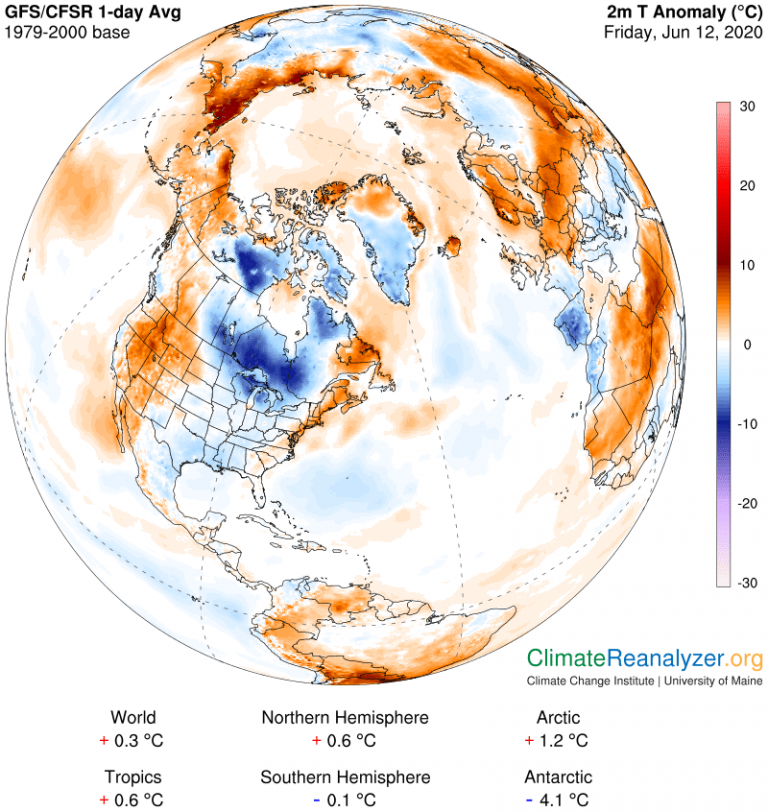

I can see no meaningful difference in anomalies for the ocean alone, which is comforting, and the same goes for the entire set of numbers under each map. Notice how the Antarctic zone was at the same extreme level of cold back then as it is now. It is probably having the same kind of cooling influence on the southern hemisphere as a whole today as then by the dumping of cold meltwater from below ice shelf surfaces into the surrounding oceans. This is not just a seasonal thing in the SH, which has hung around a net-cold-anomaly record for virtually all of the past year and shows no sign of budging from it. That leaves the NH (plus the tropical SH) carrying the full load of climate change worries for the time being. This imbalance may at least make it easier to stay within the global targets that have been set, but what are the full implications for the independent warming rate of the NH, and especially the Arctic region?
I want to show one more image today, of global rainfall and cloud cover, strictly for archiving purposes, with later this summer especially in mind to make comparisons. Yesterday we saw how clouds and rain were by themselves responsible for a great many cold anomalies, and perhaps overly plentiful as well. Is the current situation irregular in some way?

Carl