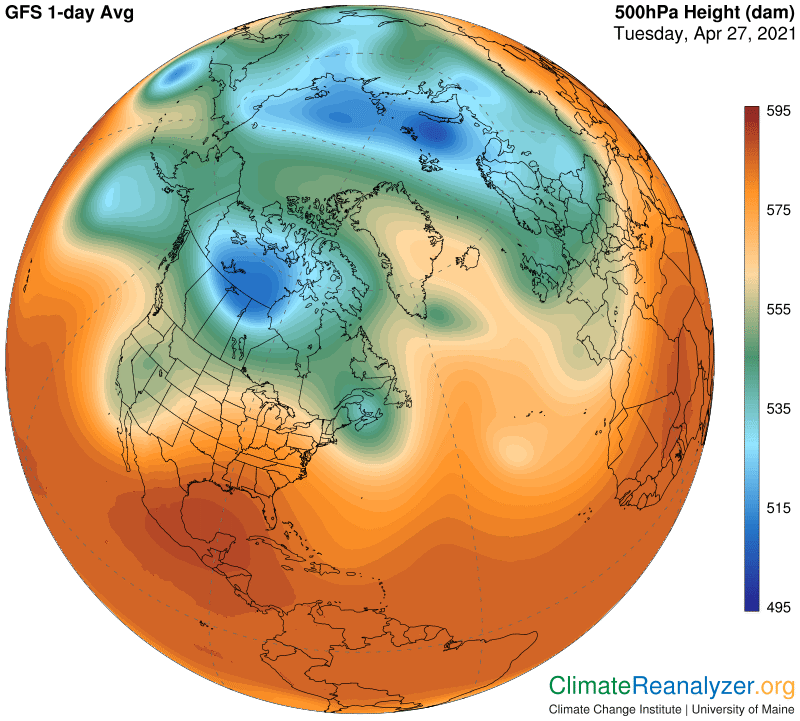
Today’s letter will focus on an extraordinary feature in the weather maps. We’ve recently seen how the blue zone on the 500hPa map in the NH has become well-separated into two parts. They are both quite robust and not too different in size. Each one is centered over surface areas having similar deep-cold temperatures, mostly in a range of minus 10-20C. What makes this especially interesting is that one of these zones sits over Canadian land, almost all of it south of the Arctic circle, while the other is right next to the North Pole, covering an iced-over ocean surface. Here they are:
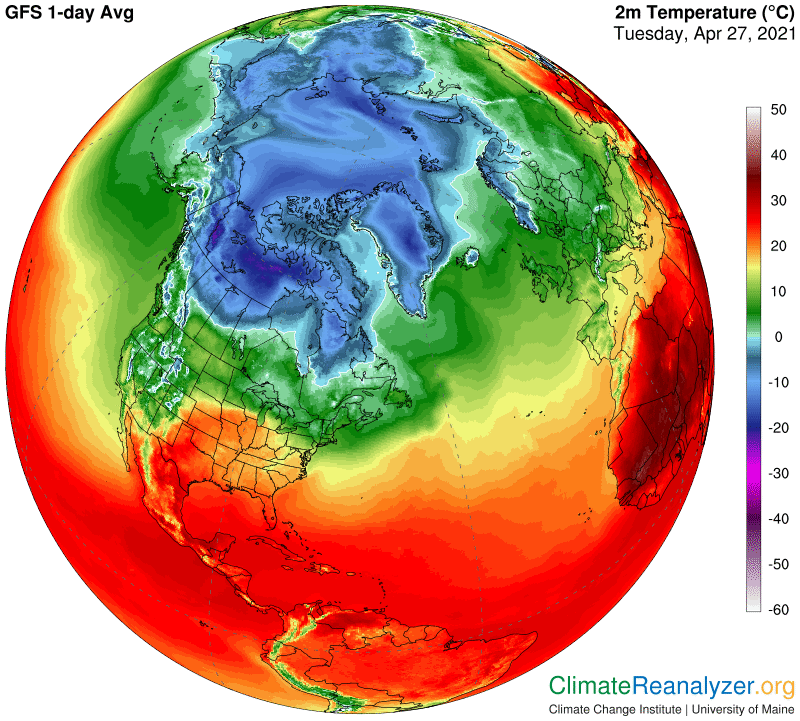
Next, a map of the related surface temperatures. From what I can see, using considerable magnification, the Canadian blue-zone surface, which happens to have thick snow cover right now (not shown), is actually somewhat colder than the one by the pole. It’s even colder than the high-top center of Greenland. This helps to explain why the zone itself is so blue, and so robust, but it still presents us with an odd situation that calls for further explanation.
There are obviously some departures from normal going on, so we’ll now take a look at the anomaly map for more information, which goes beyond expectations:
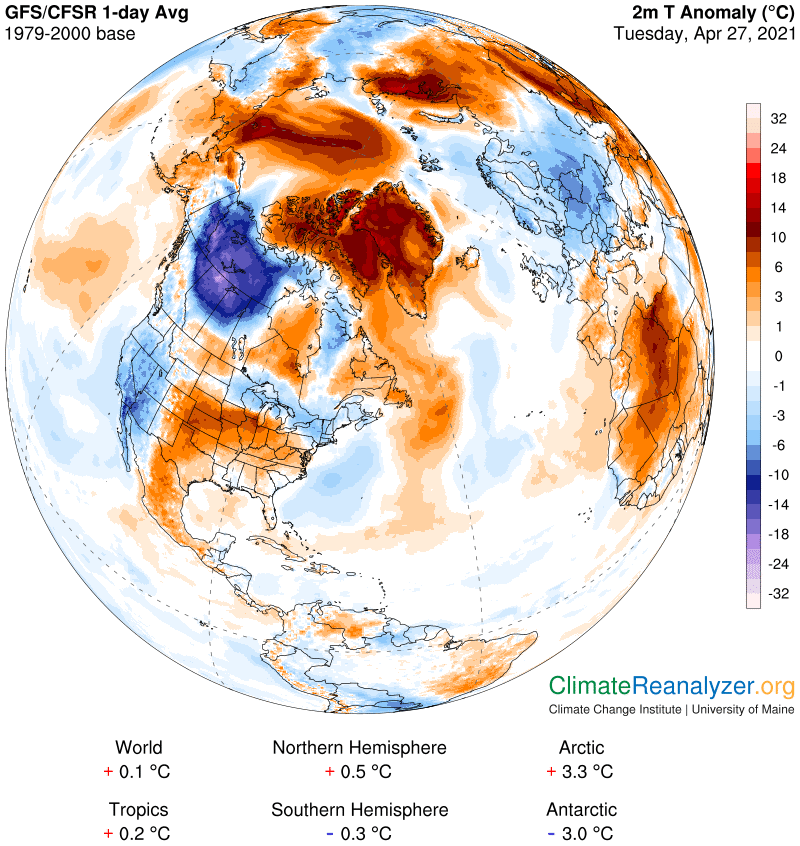
Almost everything inside the circle is very warm, much as it has been for all of the past week, while northwestern Canada is experiencing an unusually large and deep cold anomaly measured by numbers in the high teens. That one little bright spot we see in northern Alberta even has a reading in the minus 21-24 bracket (-40F). Cold anomalies reaching such an extreme are indeed rare. The few I have reported in previous letters have invariably signified massive shortfalls in the normal amount of precipitable water (PW) cover in the region’s atmosphere, so that will be the next map to visit:
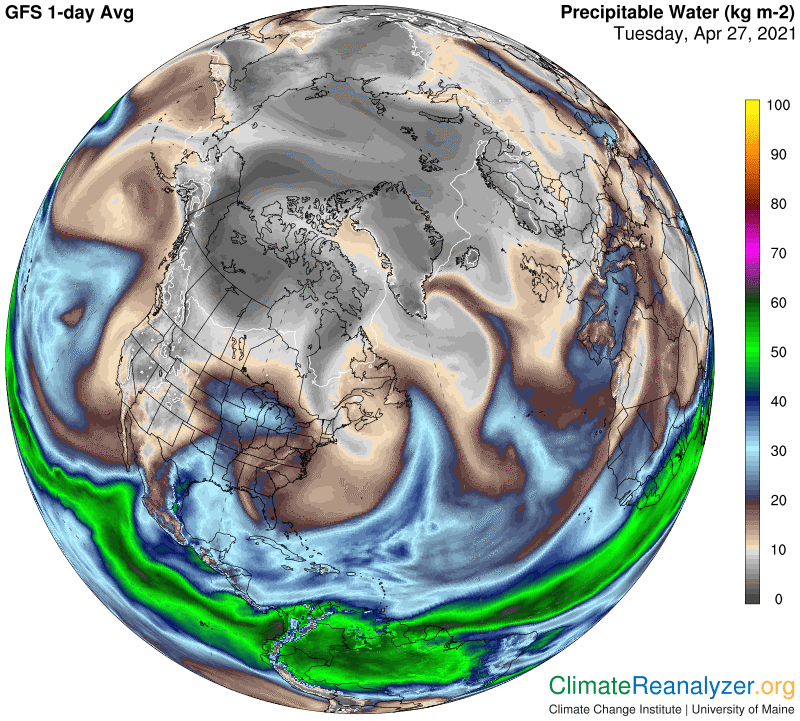
With ample magnification (and a bit of difficulty), I can pick out spots where the lowest readings are in the 1-2kg bracket, which is consistent with the very cold reported temperatures. More easily perceived, the plain raw shape of the dark gray shadings tells one that this entire anomaly location is much drier than other places at the same latitude now reporting considerably higher temperatures. Moreover, this area is as dry today as anything well to the north, where normality would be yet drier except for the current anomalous warmth due to numerous PW intrusions.
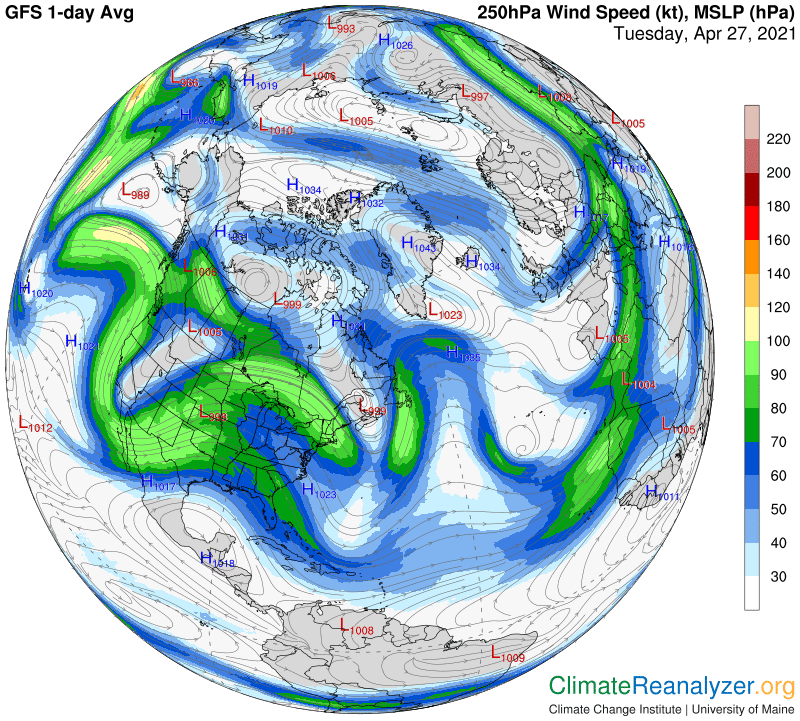
We still need to visit one more map, showing jetstream winds, for an explanation behind the very low PW content of this Canadian air. In spite of its diminutive size, the breakaway blue zone has set up a regular perimeter pathway of its own for jetstream winds to follow. Circular isobars marking the pathway are easily seen. The winds they bear are of mixed strength, plenty strong enough to keep any bits of PW from passing through the blue zone perimeter.
Carl