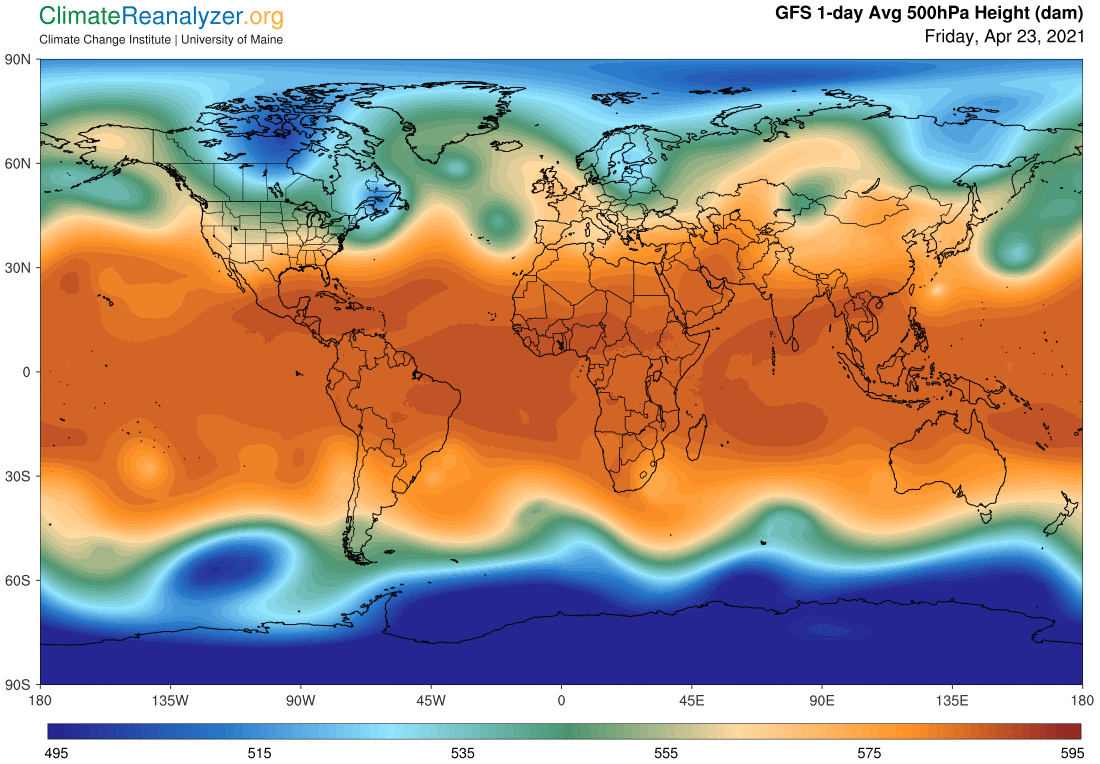
The close relationship between the high-altitude air pressure configuration (500hPa Geopot. Height) map in Today’s Weather Maps, and the positioning and strength of jetstream winds that are viewed on another map, is a vitally important factor in my complete hypothesis relevant to the mechanisms behind global temperature changes. Close observations make it very clear that that shapes taken by separated shades in the blue, green and red zones in the configuration depicted on the maps have complete control over the establishment of pathways along which the winds are blowing. That is, the winds have no other choice than to stay in positions that follow those paths, no matter how or where the paths are set up. The manner in which they are set up constantly changes, for a different set of reasons that we need not get into at this time. I will say that on some days the setup has a “regular” sort of feel about it and on other days it is much more convoluted, such that some of the usual components may even disappear for awhile. The jet wind components can do nothing more than adapt to whatever pathways are being offered. Wind velocities, meanwhile, as commonly observed, are highly dependent on the relative proximity of different pathways, apparently through a natural process of mutual acceleration whereby adjacent winds are able to give each other a push.
Anyway, the main purpose of today’s letter will be to shed a little more light on the pathway part of the mechanism, which is graphically represented on the jetstream maps in the form of isobars. Isobar lines on high-altitude maps depict the separation of differences in adjoining levels of air pressure in much the same way that similar lines do on surface maps. The patterns on the two maps differ simply because of significant changes in the environmental mechanisms that pressures respond to. The changeover is completed by somewhere around an altitude of three miles above the surface and then remains constant for another seven miles or so, when the troposphere gives way to another new kind of environment in the stratosphere. In the situation that results we can see that the troposphere, as observed in each hemisphere outside of the tropical belt, is divided into two highly distinctive layers with respect to air pressure differentials, the isobars that mark them, and the establishment of wind pathways that track along the isobars, creating an entirely independent wind system with its own unique set of behavioral characteristics..
Now let’s take a close look at actual isobars as they are set up today in this upper level pressure system. I suggest that you make the comparisons yourself, in as many places as you can on these maps, using 200% magnification. To start with, just focus on isobars, not the winds, when shifting your eyes over to the configuration map and taking note of how many of their features are closely related. To get a broad view, we’ll start with a pair of global maps:
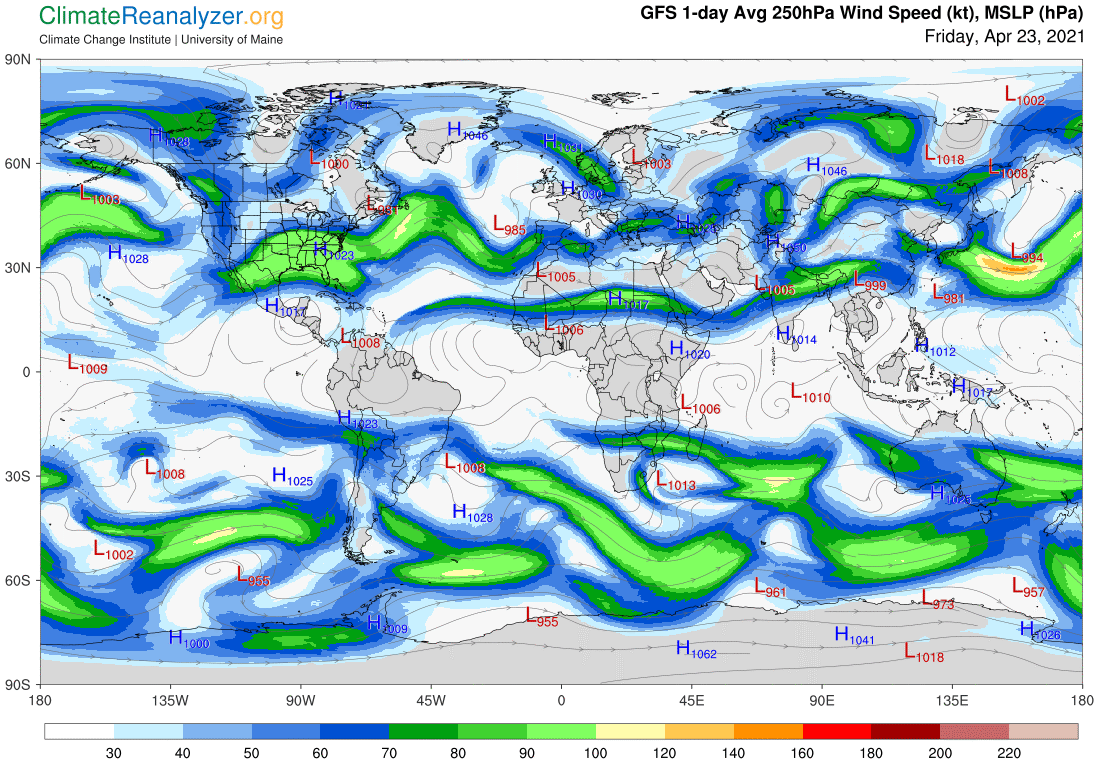
The main thing to take note of here is that in the inner parts of the tropical belt the isobars are just plain runts. They curl up and don’t go anywhere, and being few in number there is no amount of closeness in between. That means there are no meaningful pressure differentials in place to speak of and hence no pathways can be set up for winds to follow. Pathways only begin to exist when certain proper requirements are met, which are first observed in higher latitudes of around 15-20 degrees. Now we’ll look at two regional map scenes where the principal requirements are widely met and much more isobar detail is able to be rendered:
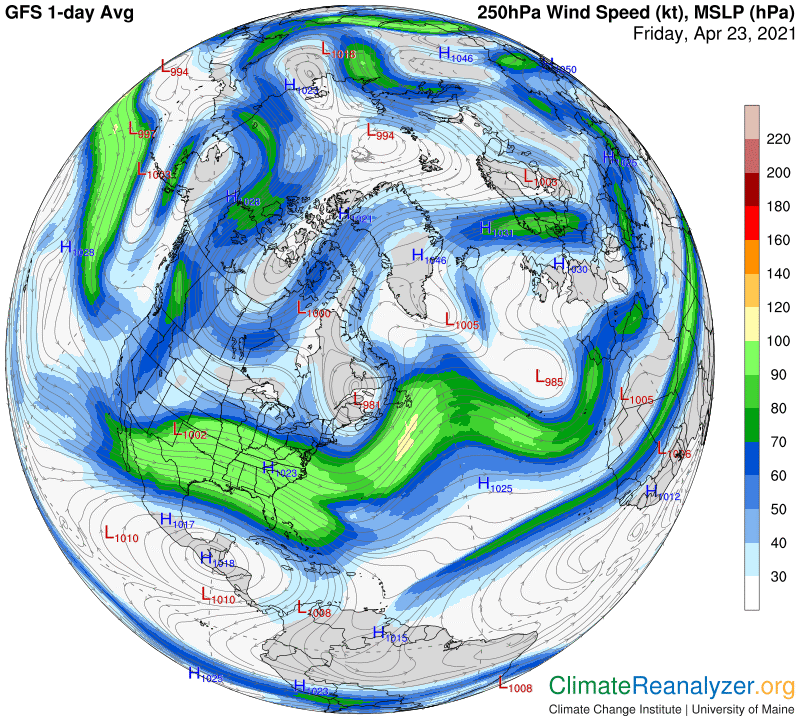
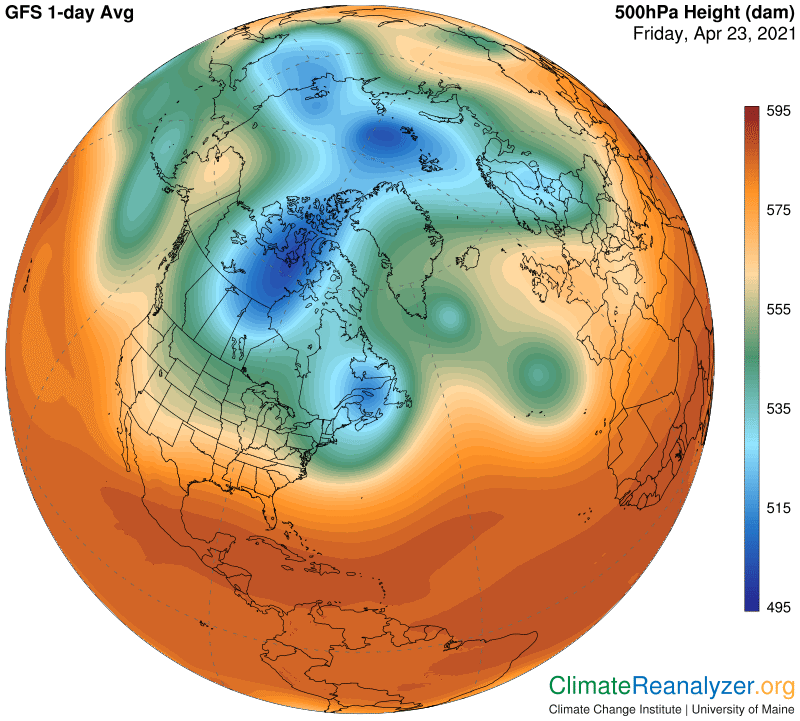
If you have a little extra time you can have a lot of fun and fascination matching up various isobar arrangements with corresponding features on the configuration map. See for example how circular “pressure centers” get set up in certain strategic places, and compare these with the long strings of parallel isobars that are more common, also strategically located as they trend along the shaded borders of the configuration zones. This particular region is full of complicating factors today. Then go on to see how the winds actually respond in the way they blow, or don’t blow, on all of the different isobar pathways that have been set up for them. Enjoy.
Carl