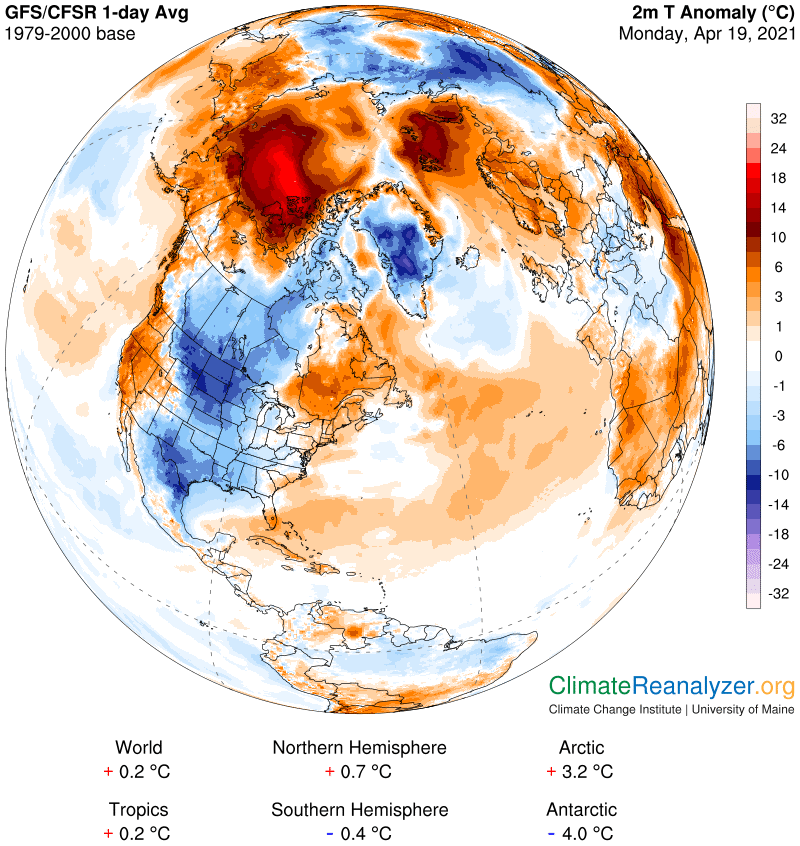
Today, the Arctic Ocean and the seas that surround it are nearly 100% engulfed in a substantial warm air anomaly, enough so to be considered a cause for concern. Roughly half of this surface show readings near +10C or more, with one area about one-third the size of Alaska in the +18-21 bracket. The bit-sized “cold” anomalies are at most only -2C. Meanwhile, on a larger perspective, the entire Arctic region, at +3.2C, stands in sharp contrast with the -4.0 of the Antarctic. Explanations are needed, and they are available from the Weather Maps, so let’s get at it, with a primary focus on happenings in the north:
There is one explanation, the only one I know of, that makes sense of the whole situation and can readily be demonstrated. The ocean surface is in fact being overridden by the remnants of two massive streams of high-altitude precipitable water (PW), one of which originated in the Pacific and the other in the Atlantic. Stream contents heading toward the pole have penetrated barriers set up by jetstream winds that are no longer as strong or well-organized as they were in the past at this time of year. This situation is only true in the north. In the south the barriers are stronger, in their regular place, and effectively working normally. Here is what the PW streams in the north generally look like, from start to finish, over five or six days of continuous movement:
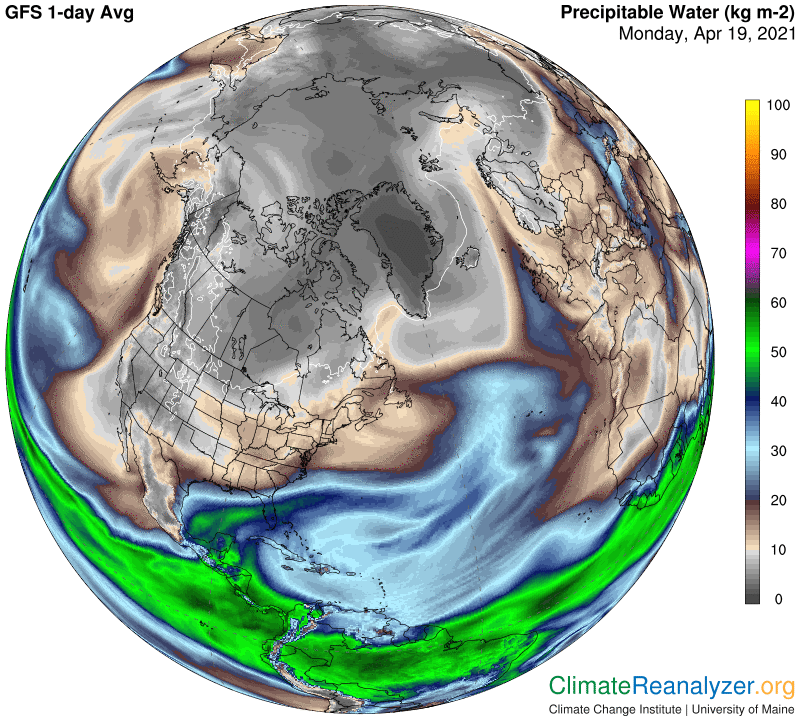
Both streams become significantly whittled down as they travel northward. Their total atmospheric content, some of which is near the surface and relatively less mobile, is always measurable, based on the relative weight of vertical columns. The stream remnants that realize the final stages of penetration while moving at random create the extra warming via the localized provision of additional greenhouse energy effects. Their molecules often outweigh those of the less mobile PW that exists close to the surface by considerable factors, sometimes as much as 4 to 5 times, or even more. Each double, as it occurs, can be found to add about 10C to surface air temperatures through the extra greenhouse effect, but only for as long as the relationship lasts. (Part of any of this extra greenhouse effect is in fact retained for a longer period of time by the more dense matter that makes up the surface itself, a subject I will come back to at another time.)
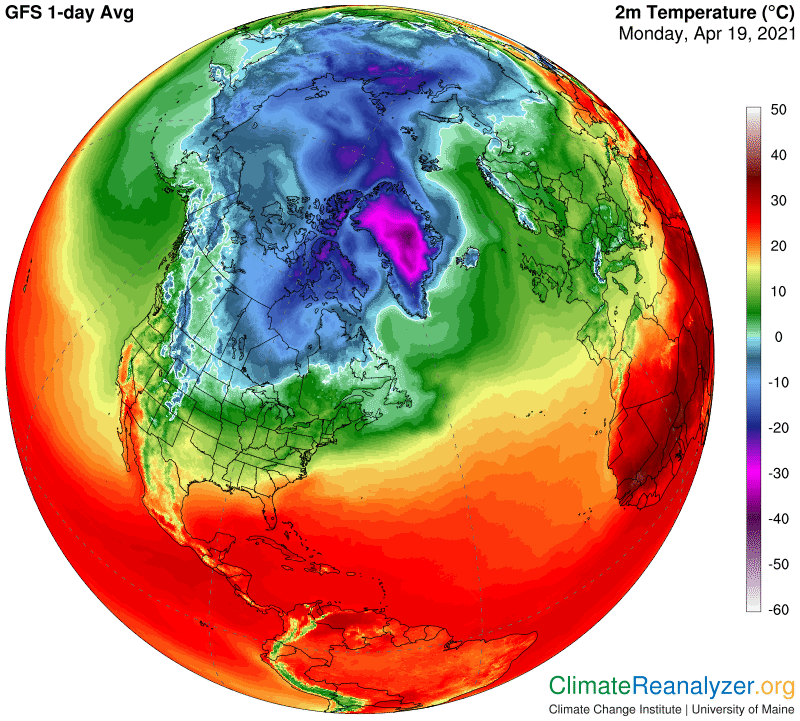
On the above two maps you will find that the bright red spot where the anomaly is +18-21C corresponds closely in position with a patch of PW that has readings in the 7-8kg bracket. I think the average PW value for that patch on this day of the year would be in the upper part of the 1-2kg bracket, more like the spots near the pole that today have minimal anomalies, except for being fractionally higher because of residing in a place of lower latitude. The next map shows actual average temperatures for this day, where the warmest anomaly spot has a reading of one-half degree above zero, seen as a dull shade of light green on the color scale, while the cooler spots near the pole (magnification needed) look like they average around minus-22C.
Mostly for purposes of future reference, I do want to include the jetstream map for today, which is full of twists and turns, and not much in the way of velocity in the more northerly parts. As usual, you can find some interesting relationships with the movement of courses taken by the PW streams.
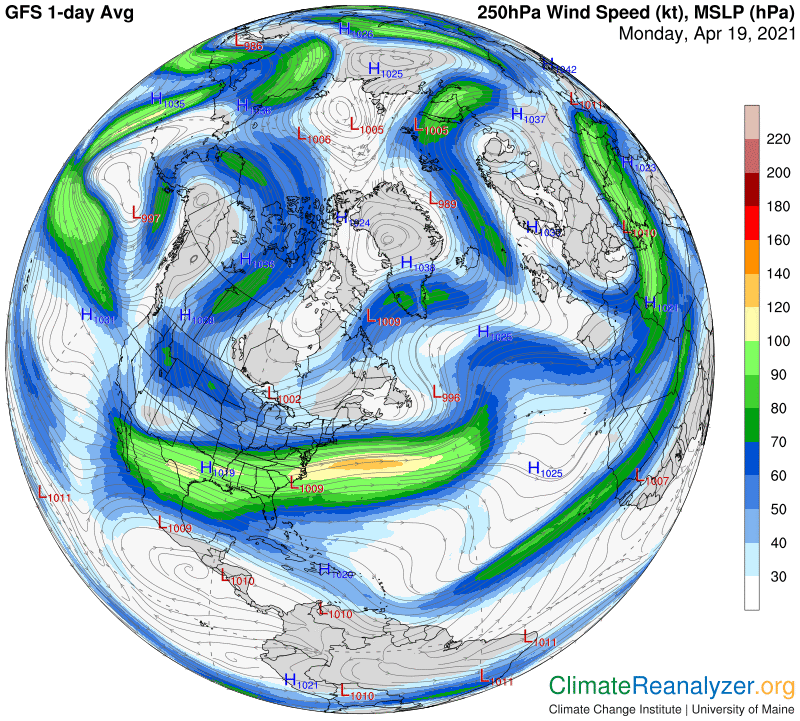
You may also want to accept the challenge of tracing the three major jetstream wind pathways, blue, green and red, as they follow the tracks laid out by the high-altitude air pressure configuration pattern. The relationships get confused in a few of the more off-beat situations, but otherwise never fail.
Carl