Today I will run a sequence of images like those of yesterday, but from a different region and with the focus changing to a much smaller scale. We’ll be looking at connections tied to the polyp shape of the 500hPa green zone of high-altitude air pressure readings that extends downward over the edge of Eastern Europe, through Turkey and into the Mediterranean.

The complete green zone, for the most part (around 90%), appears over surfaces where air temperatures for the day average somewhere between freezing and about 10 or 12 degrees C. On this next map I have chosen to show highs for the day instead of averages simply because the outline of the polyp shape at this designation stands out so well in contrast with the nearby red zone that overlies much of Europe to the west. The entire red zone shading area of air presure, with a few minor exceptions, covers all parts of the globe that are over about 12C in temperature, while blue (plus magenta) basically catches everything below freezing. All of these connections are determined by relative air pressure effects that depend on differences in the way the density of surface air expands or contracts depending on its temperature. The upward transmission of those differences, covering about three miles of spatial elevation, is in general remarkably efficient but not always perfect.
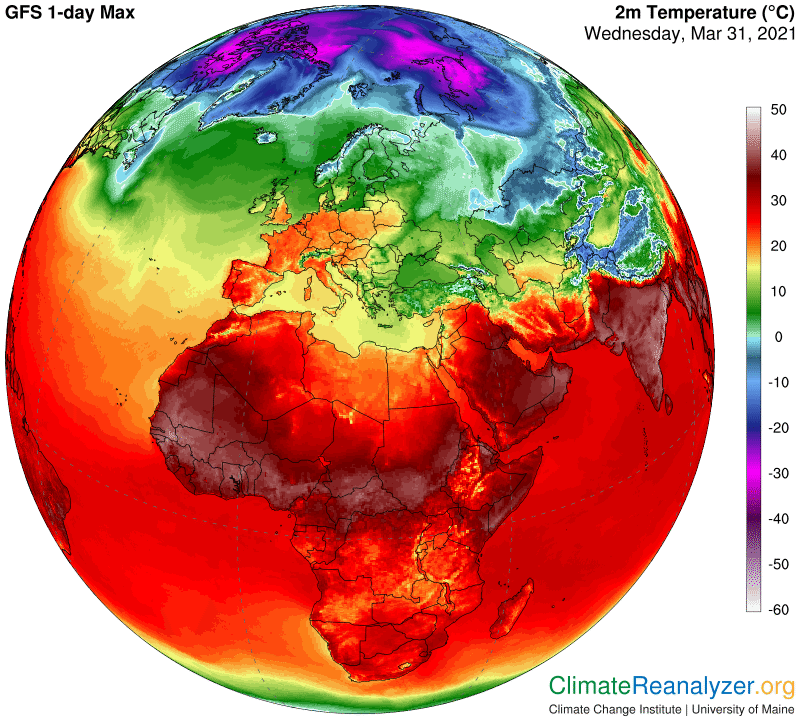
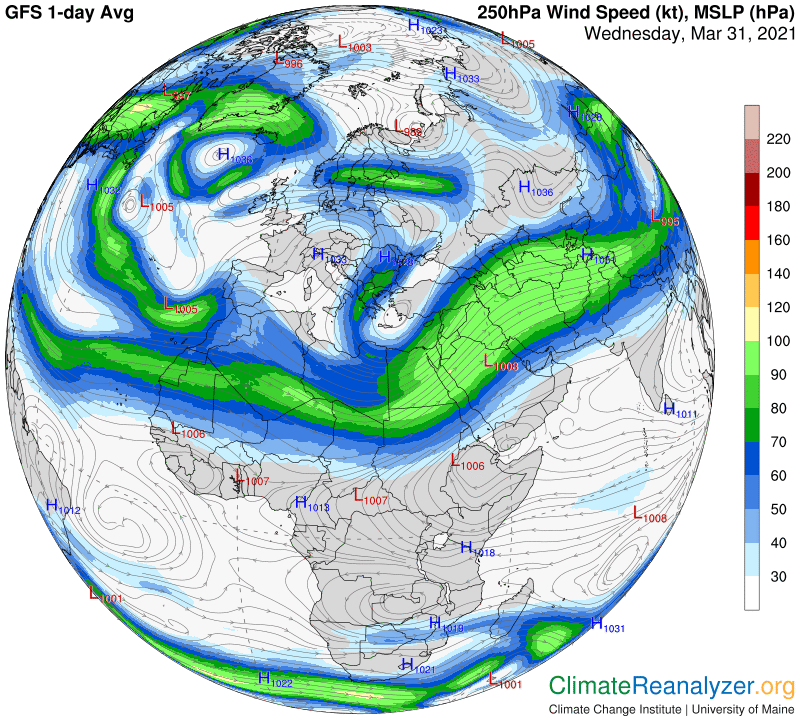
As most readers should know by now, the outer fringe of the green zone, no matter where it is found, is home to a major jetstream pathway that has constant control over the location and speed of the winds that follow its track. Here you can see a fine example of how this plays out in reality, as a wind of this kind swings around the polyp. The isobars you see on the map actually do the work of managing the setup. The green shading on the first map just tells you where to look for this particular set of special isobars.
The hypothesis I have developed over the past year holds that jetstream wind activity has a powerful influence over the movement of any concentrations of precipitable water (PW) that are found to exist at this level. These PW streams all display a natural tendency to keep moving, with movement having a bias that is poleward as well as toward the east. Jetstream winds that make contact with PW streams are in some cases positioned in a way that favors this movement, while others are not, perhaps even blocking all further movement. The wind that arcs around the polyp we are looking at is of the unfavorable type, effectively reducing the total amount of PW able to enter the atmosphere on the inside of the loop. On this next map you can see where the line of dark brown PW shading on the west side of the loop where the wind image is located converts into lighter tones in the inside part, including gray. The absence of an extra amount of PW serves to reinforce the coldness of temperatures in that particular location, as observed in the second map above.
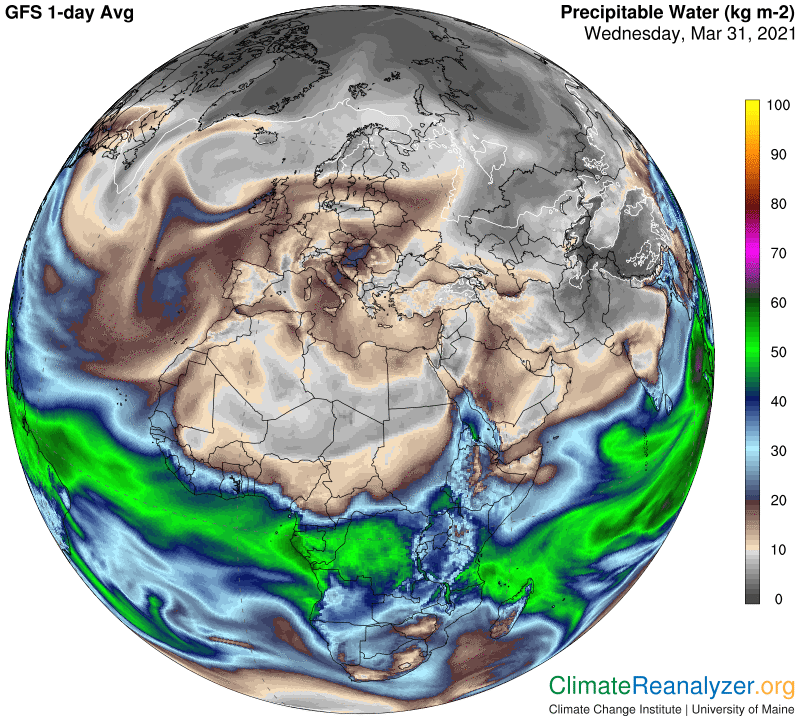
The entire large display of dark brown shading to the west has its own story to tell, which is equally interesting. It is possible to trace it origin on these maps to a favorable green zone jet that swung around the end of the other polyp shape of air pressure off to the west, then just fell apart instead of turning north with the polyp’s edge. This jet must have been carrying a heavy load of PW that had been acquired from the Caribbean area of the Atlantic, all of which was abruptly turned loose when the wind stopped. The PW, now moving on its own, spread out over a wide area, including much of Europe, bringing the energy that created the very warm temperatures we are seeing, including some of the “red-zone” producing type, until the spread was blocked by unfavorable wind conditions well to the north. Everywhere you look there are stories like this that can be told.
Carl