The North American cold wave has produced a (for me) first-time event on the anomaly map that is surely worthy of a full description. On the map you will see a couple of small, lightly shaded spots in west Texas not far from Odessa and San Angelo. The reading for that shade is a very rare minus 28-32C, which means greater than -50F. A majority of the entire state plus parts of six other states are in minus 24-28C zones, which is just as remarkable.
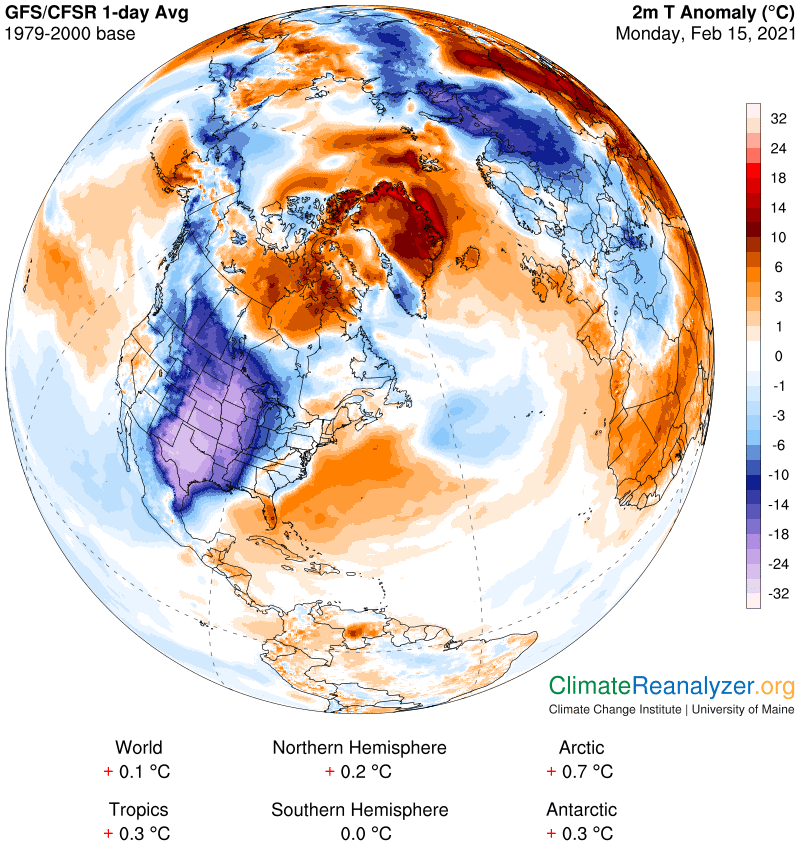
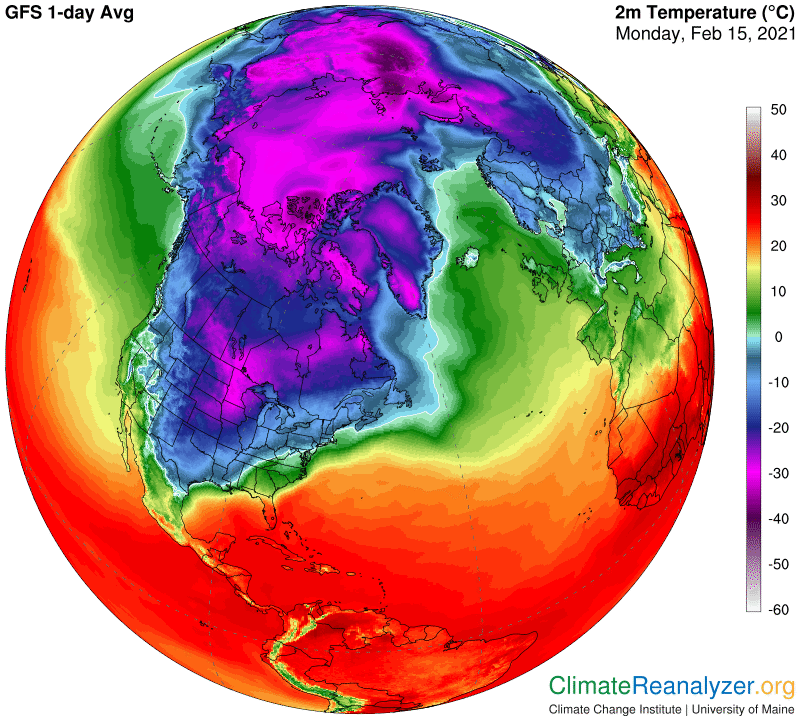
Actual average temperatures for all of the cold wave area are also quite amazing. On this map everything inside of the huge area surrounded by a thin light green line is below the freezing point, 0C/32F. Moving in from there, when you reach the vivid medium-blue shading, think -10C, after which the darker shadings start. The area holding the greatest anomaly registers about -12C, (+10F) in temperature, which means normal must be about +60F. Lows for the area that day were all of -15C (+5F).
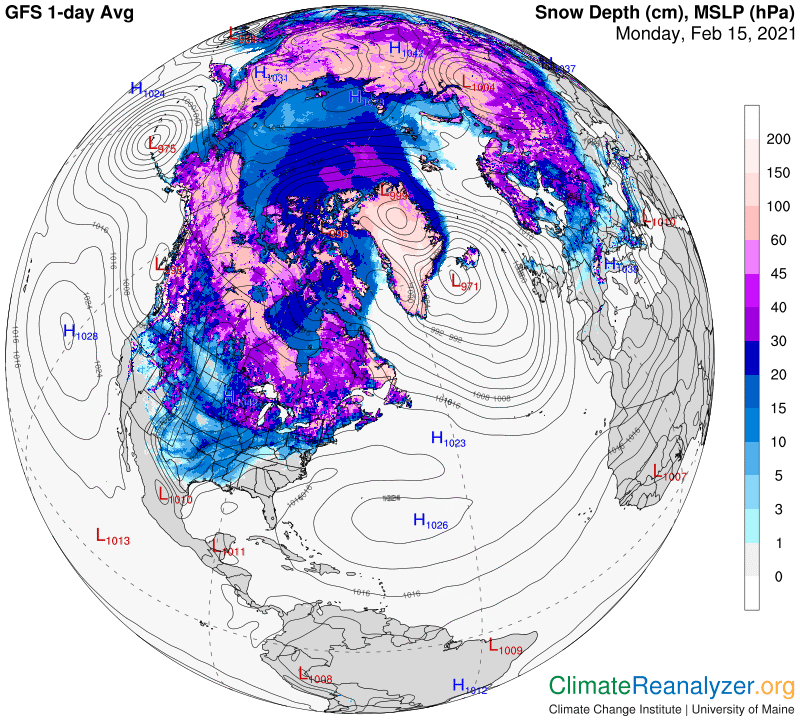
The explanation for such a large anomaly is sure to involve precipitable water (PW), but that’s not all in this case—the cold wave has already put a fair amount of snow on the ground. This does two things to temperature, first by reflecting away much of the sun’s incoming radiation, so the ground can’t warm up.as it usually does. Also, by acting as a layer of insulation, heat that is already in the ground can’t escape the way it usually does. Together these functions takes away much of the basis for warming of air temperatures. The exact difference here, which I’m not sure of, could be substantial, perhaps causing up to one-third of the total cold anomaly in this situation.
A large shortfall in the normal PW reading should then be expected in order to explain most of the remainder of the anomaly. To investigate we turn as usual to this map:
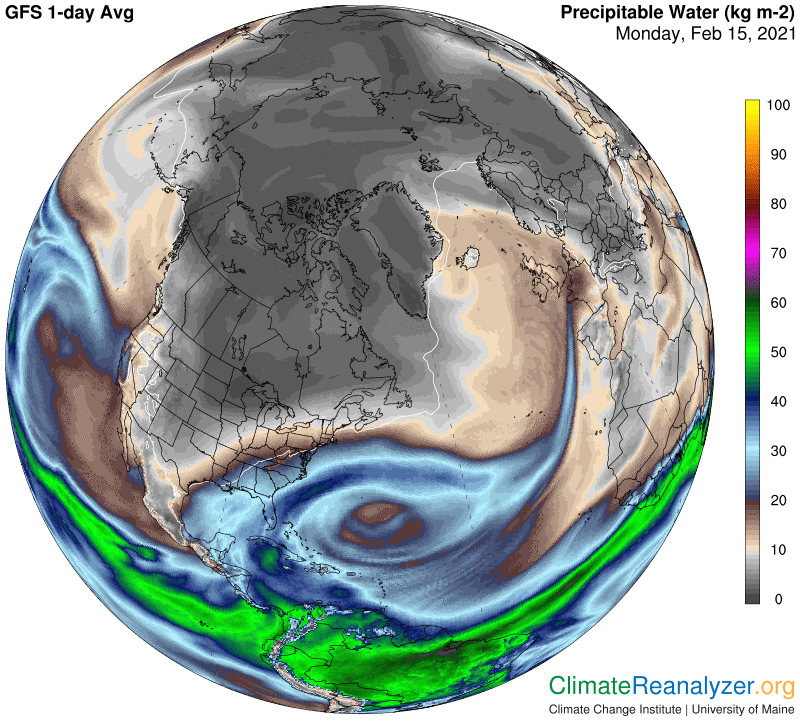
The reading I see for the anomaly, with the help of lots of magnification, is in the notch between 5 and 6kg. This would suggest that a normal reading of something over 20kg is needed in order to make room for two halvings that are by rule required to cover the actual loss of 20C or so that remains to be accounted for. With no hard data available, we can only look around for nearby areas that do show 20kg, and see how they are doing with anomalies of their own. There are some such areas in northern Mexico and more in eastern Texas, both of which also show substantial cold anomalies at this time. Thus, highly humid PW readings ranging from 20kg up to 30 or so may be realistic for this entire southern region on this day–and would not be hard to verify with a little extra time and effort.
We are still left with questions about the basic circumstances responsible for the rare amounts of snowfall, the low PW values, and whatever else is causing this massive cold wave. There is in fact a powerful jetstream wind in place that can do the job quite nicely, enhanced by the way it keeps hanging around for a few extra days while penetrating more deeply southward. This sloping direction of movement, away from the pole and toward the equator, ordinarily means the jet will be low in PW content, totally the opposite of jets on a more northward course. The latter can easily carry a heavy load of PW, which will ultimately either rain out or else spill out whenever the jet bends around and heads toward the south. The jet wind itself keeps any high-altitude PW streams making an approach from the central Pacific from moving across its flow and over the continent, leaving a more barren outcome everywhere to the East.
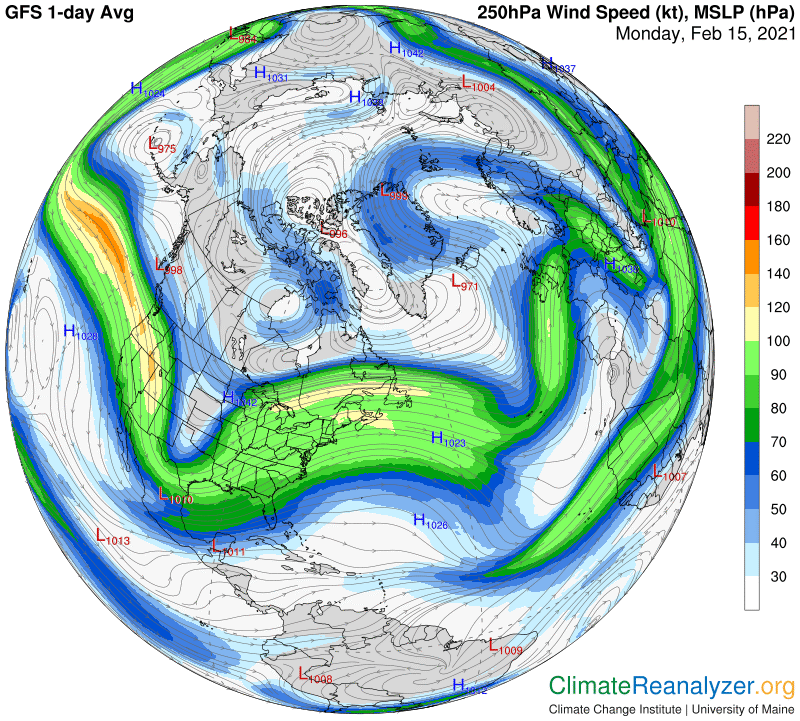
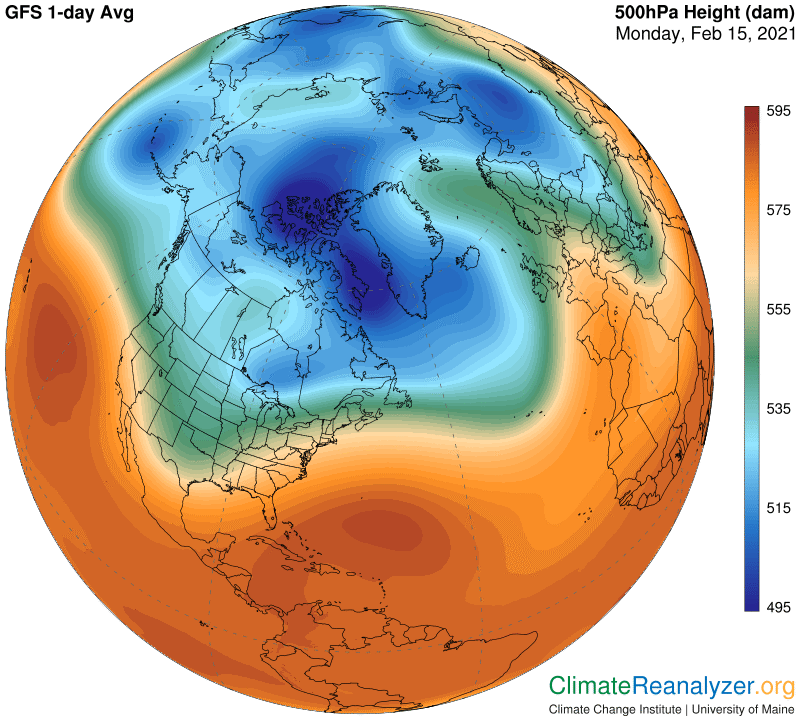
All jetstream pathways and the winds they bear are where they are for one good reason—governed by the shaping of the 500hPa air pressure configuration. This jet pathway follows the outer fringe of the green zone on the left side of this map, which directs it southward over a long distance and also presses this pathway into close proximity with a regular red-zone pathway, part of which is heading the same way. The two winds can then combine forces in a way that ups their speed by mutual acceleration.
Carl