I have spent most of the morning looking for locations of jetstream pathways on high-altitude air pressure imagery, how jetstream wind speeds are affected by the relative positioning of these pathways, and what the ultimate effects are on the movement of high-altitude streams of precipitable water (PW). This is part of an ongoing research project where the goal is simply to learn as much as possible from a very elementary set of Weather Map tools. Some of the results keep getting more clear while others need more study. Those others generally involve extra complexity that shows up whenever the air pressure pattern becomes more irregular, as much of it is today in the Arctic:
Let’s move directly to the resulting structure of jetstream winds and do some tracking:
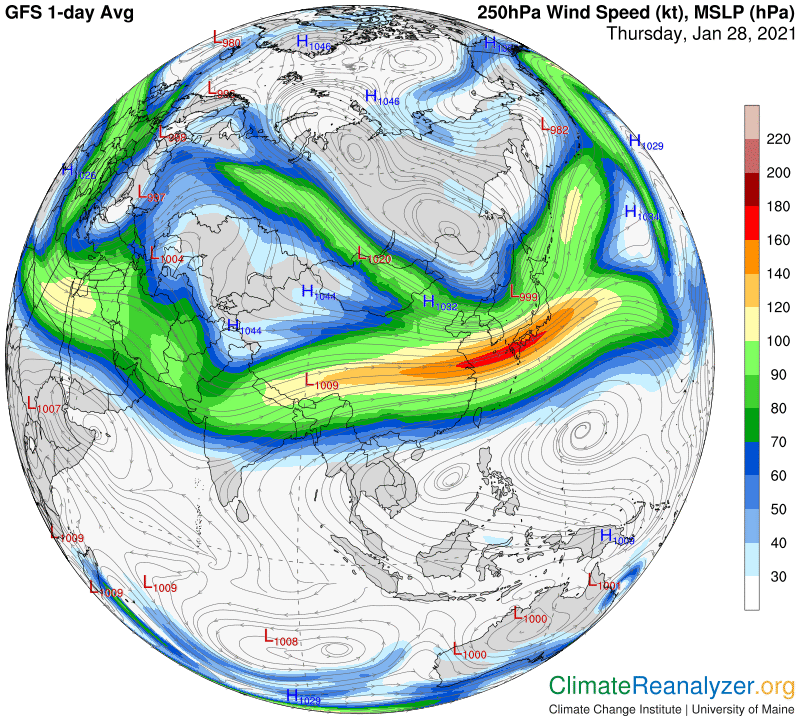
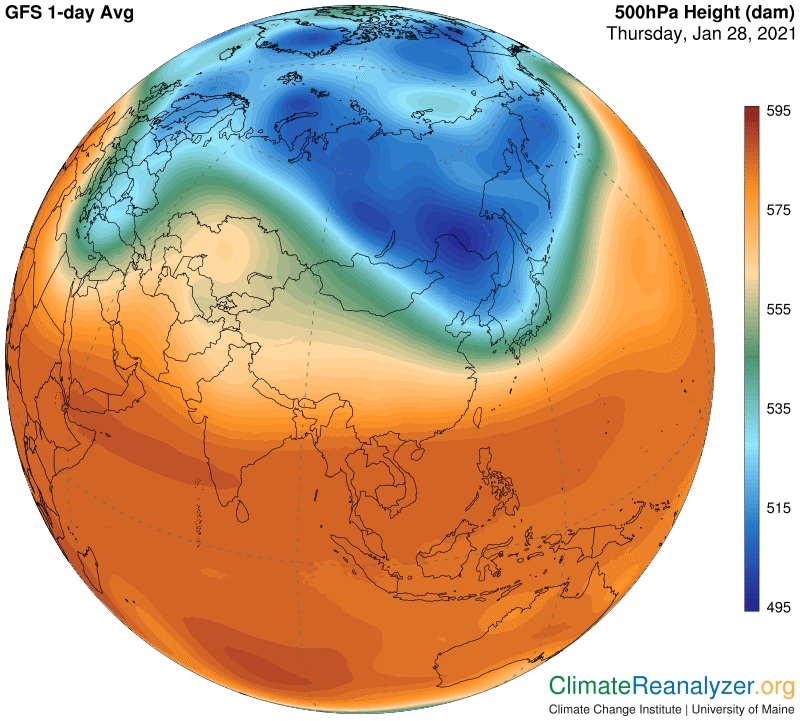
It’s easy to see how wind streams consistently follow the track of the pathway set by the light blue line (and also light blue diffused shading) practically everywhere it goes. See how the wind on this pathway is not particularly strong when set well apart from other pathways but is still quite consistent, keeping it visible for our purposes. This pathway could also be designated in terms of its altitude on this 500hPa map, about 5270 meters, which does not vary. It is located at this point—as are the three other pathways we will meet—because of a regular and relatively significant deviation in air pressure compared with adjacent pressures at this same hPa level. The next pathway is represented by the fringe area of the green zone, centered at about 5450 meters on this readout, Its winds are also of quite consistent and relatively moderate strength when isolated away from other paths. These two innermost pathways are normally in close proximity, which tends to accelerate their combined wind speed.
When we move on out past the green zone and into the red zone things get more complicated. I am now pretty certain about the existence of two regular but separate pathways, both of which are not often distinctively visible. On this map I am able to locate one at about 5602 meters and the other at 5840. Also on this map one can see that the strongest of wind velocities seem to appear within the space between these two pathways, with the very strongest of all when these two paths are crunched together and also in close proximity to the green zone pathway. Separately, you can follow each of the red zone wind paths fairly consistently on this map by focusing on dark blue lines of shading. Whenever pathways are positioned well to the south the internal wind speeds will tend to become less visible and may even drop out of sight, leaving connections made by isobar markings as the best way to locate pathway continuation in some cases.
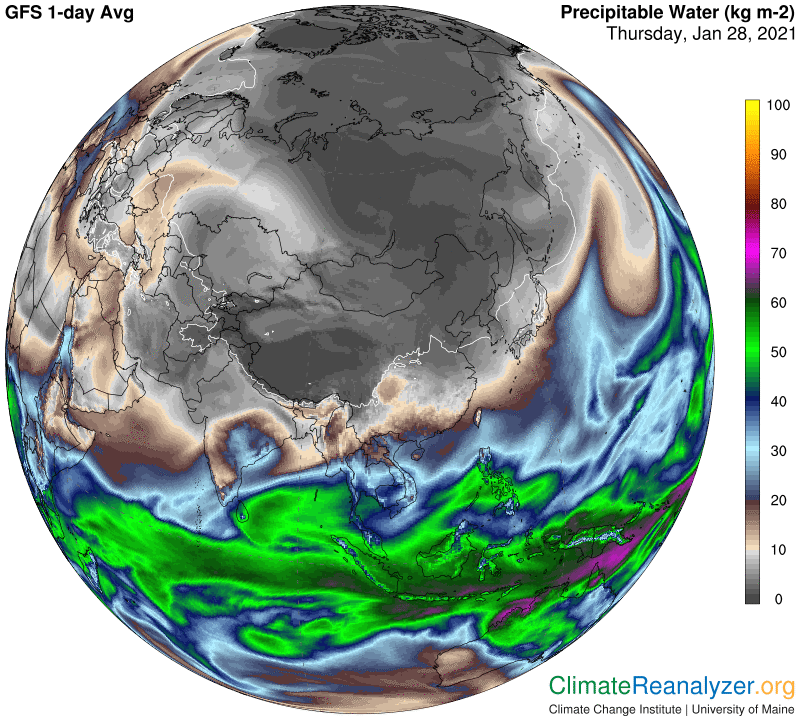
We always want to know how these various arrangements will work out in terms of guiding the movement of PW streams, since that is how surface temperatures are ultimately affected. The two innermost jetstream pathways seem to have the strongest affect in terms of setting limits on PW activity, in spite of not being able to express the strongest wind velocities, either by themselves or when together. Today’s PW map, shown next, tends to bear out this view in an overall way, but details relevant to the influence the two red zone pathways actually have on PW control are more nuanced and less definitive.
Carl