There is a fascinating conjunction of extreme temperature anomalies in the Weather Maps today that has a story to tell, nicely illustrated. Over and over again I have made the claim that, when everything else is equal, including the day of the year, for any one location outside of the tropical belt, each and every doubling in the total amount of precipitable water (PW) in the atmosphere above the location will add 10 degrees C to surface air temperature for that day. I have also promised that I could demonstrate the validity of this claim by finding real evidence of proof within the Weather Maps on any day of the year. On some days that evidence takes a little extra work to uncover and explain. On other days it will just stand up and shout. Today is one of those.
On many days the trickiest part is figuring out what the actual “normal” PW would be, which means finding the true average for that same location on the same day of the year throughout an appropriate baseline period. Since good information is simply not available we have to depend on estimating skills. The alternative is to find nearby locations with about the same geography where many things show unusual differences on that day, reliably illustrated, such that we can fully analyze those differences and draw valid conclusions. That’s what we have here, so let’s start with a look at the reported simultaneous anomalies of two such locations:
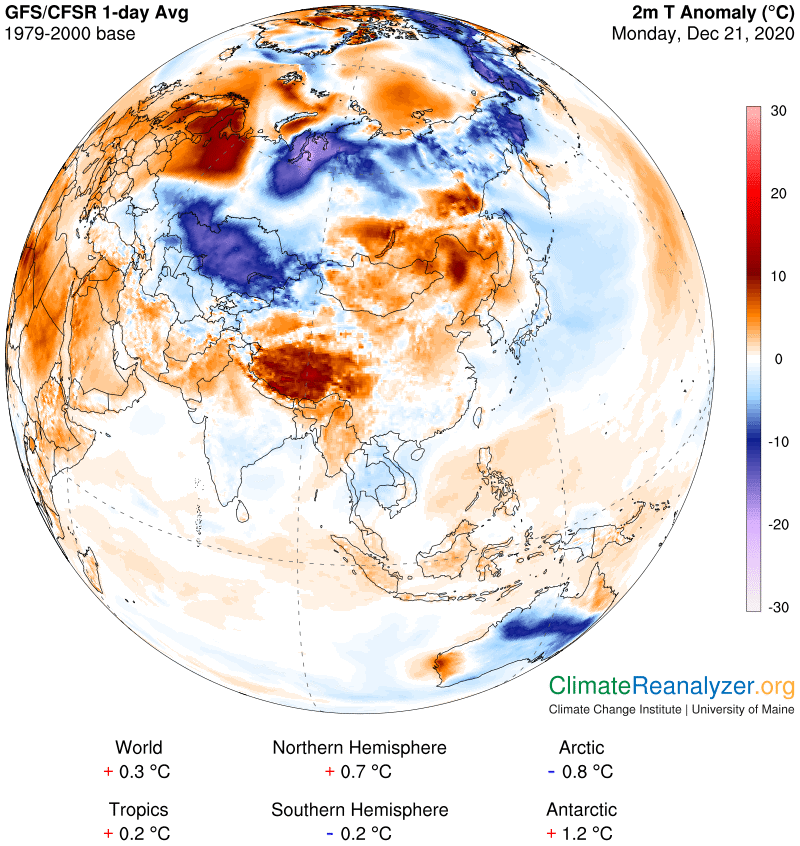
Note the large and strong cold anomaly in the left center. Right above it you will see a warm anomaly paired with a cold one, not far apart, with both of them having central portions that have readings of an extreme type. The warm one on the left has a top reading of about +14C, the cold one a low spot around -18, for a total difference of 32C, or 58F. (It helps to magnify the images.) These locations appear to be reasonably similar in geography and for that reason should have quite similar temperatures on most days, or almost never this far apart. Something most unusual must be happening to cause the discrepancy.
The Windy.com website can be put to good use for double-checking certain things. As I write, the temperature difference between the two sites is still about 30 degrees. Earlier I saw it closer to 35, so that checks. Snow cover could be important. Windy shows an average of around 6-8 inches in the warm area and 22 where it’s cold. That could—perhaps—make a little bit of difference, but not much. Cloud cover shows a few more clouds in the warm area, but albedo could hardly be a factor at this latitude in any event. We still have all of 30 degrees or more that need explaining, and the PW map yet to look at. 30 degrees is of course the same as 3X10, which according to my rule would call for the low PW reading to be doubled no fewer than three times in order to realize the necessary result on the warm side. Which means the warm area would need to be averaging eight times as much PW in the atmosphere as the nearby cold area on this particular day. So here we go:
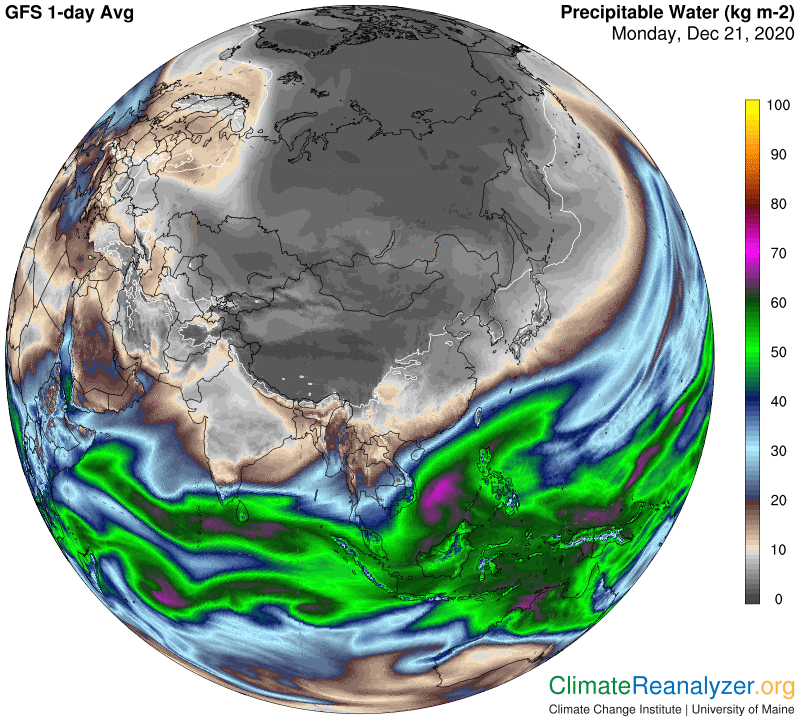
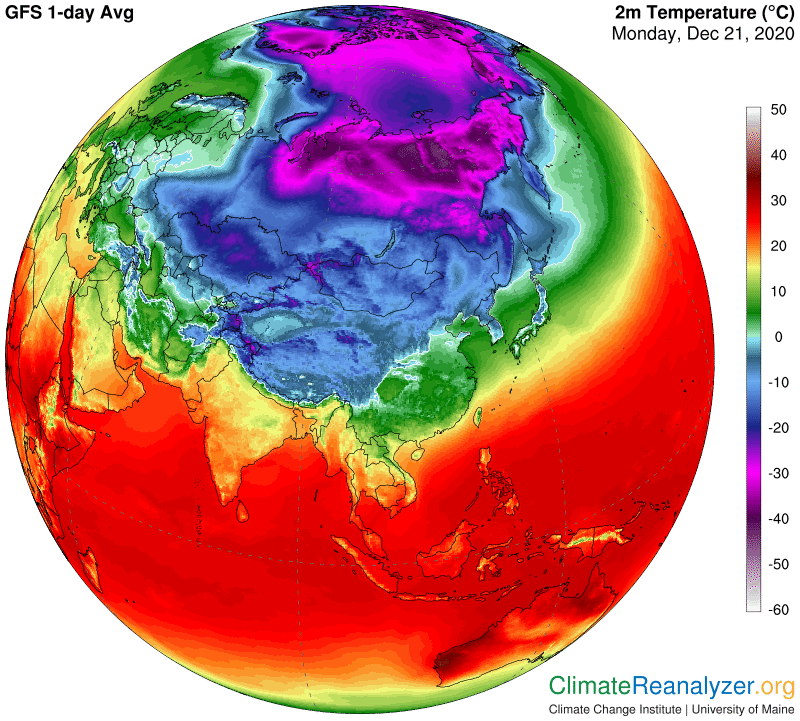
Again, use magnification, right up to 200%. I see the warm area with a reading of 12-13kg. On the cold side all we know for sure, from the gray shading, is that it is less than 2kg, but more than 1. There is a spot of 1kg to be seen quite close to the targeted anomaly, suggesting that the cold-side PW reading could be closer to 1kg than 2. We can start with 1.5kg to see how it works. Multiply it by 8, the same as three doubles, and you get 12. It works, and it could maybe even be less than 1.5. If you see a flaw in this analysis, will you let me know? (I have an email address in the upper right corner.) Or do you know of something else that could possibly duplicate the end result? For good measure I will throw in the Weather Map showing how it reported average temperatures for the day. I am seeing +2C in the warm area and about -34 where it is cold, a 36C spread. So maybe there was something more than three PW doubles at work here yesterday? Maybe the best interpretation for the cold side was really only about 1.3kg?
Carl