The Arctic is still hot. It hasn’t missed a day for major temperature anomalies since September 24. As usual, some spots of pretty good size are reporting numbers around the +20C level, a figure that—for a short time—is not uncommon in winter in either of the polar zones. What is really strange in this case is the unending durability of the warm anomaly as a whole over such a large area, particular when so much of it, over almost the entire ocean, has been stuck at +10C or more. Greenland is much more normal, with every day being different and lots of back and forth between hot and cold. Here’s the map:
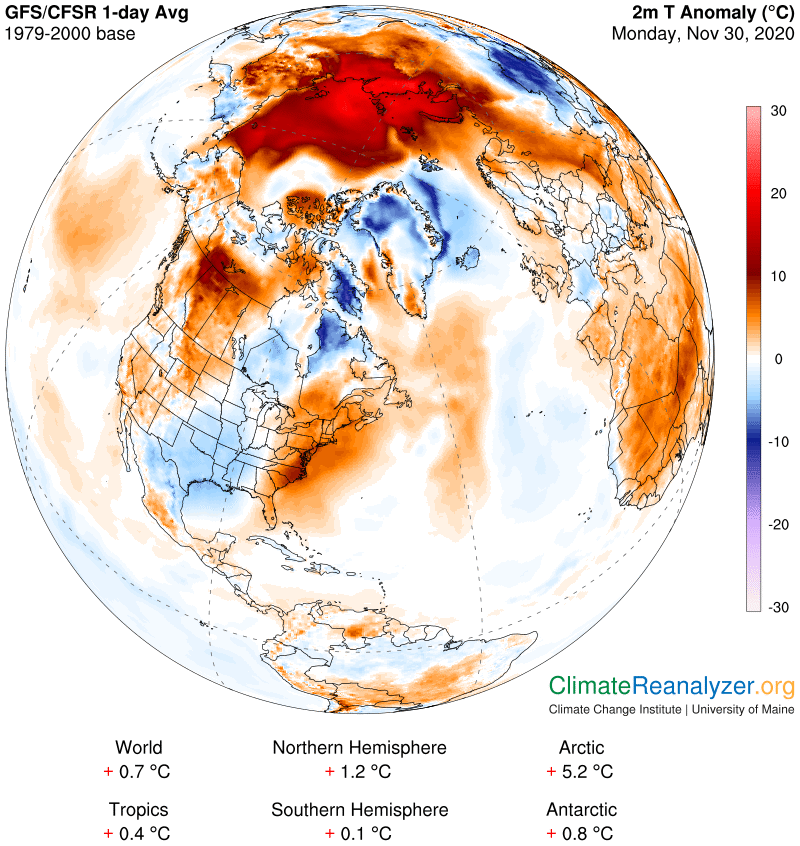
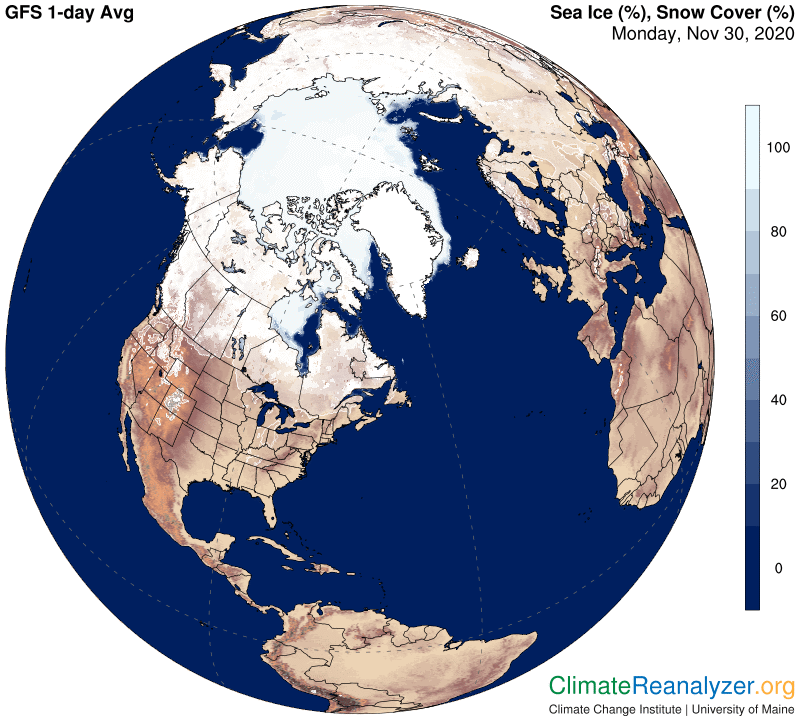
The work I am doing treats every day’s anomaly as if it were a new event, with a whole new set of causal factors. The ocean area is a partial exception to the rule, with one good reason for having extra durability. There are places that should have been frozen over maybe a month ago but are still ice-free, and any such spot will show a fairly large warm anomaly every day, without fail, until it freezes. These spots are slowly disappearing, and I”ll put a map at the end of the letter for use as reference. Other than sea ice there is not much left that has the power to cause large daily anomalies other than Total Precipitable Water (TPW), the amount of which, relevant to any one location, always varies to a possibly considerable extent from day to day. Within the polar zone the variations are relatively quite small if you only look at them in terms of raw numbers of change in measured volume. If you take the same numbers and think in terms of percentage changes, which I think are (separately) applicable to all greenhouse gases, you get an entirely different story. Arguably, TPW, whether or not it is all vapor or partly condensed, seems to function pretty much as if it were vapor alone when it comes to exercising greenhouse energy effects. That means (again arguably) any double in TPW above a baseline normal should tend to raise air temperature at the surface by 10 degrees C, using the same baseline of reference, in any subtropical zone.
According to this outlook, if the Arctic Ocean’s air temperature anomaly stays about the same day after day, and absence of sea ice in spots is a limited (and declining) reason for the anomaly, and TPW is the only other agency that can cause such large daily anomalies, then the TPW effect must in fact be holding rather steady from day to day instead of changing all the time in the way it normally does. The only way to find out if this is true is by opening up the most relevant maps every day, giving them a computer magnification of perhaps 200%, and digging into all the details by making comparisons spot by spot. This would take more time and tools than most of us have or could afford, but even doing so in a casual way suggests that the possibility for amazing consistency might be real. Let’s open today’s TPW map and see what comes for this one day:
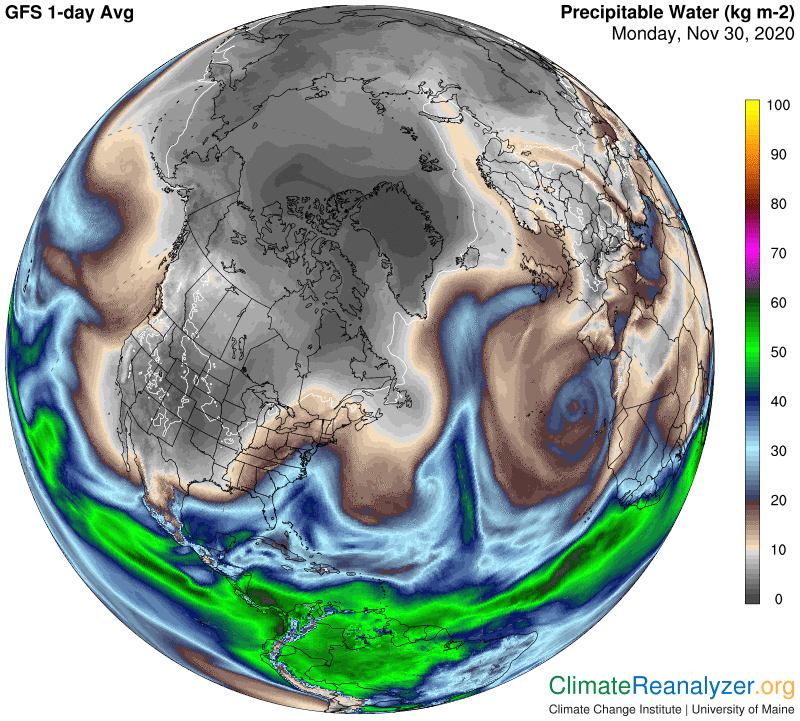
Three and maybe four different vapor streams can readily be seen making contributions today, which is not unusual. Streams keep varying in many different ways, while alternating from one side to another. The one that is currently the most powerful is the one having a source in the middle of the Atlantic. Using magnification, follow this stream to the point where it tends to disintegrate from a concentrated form and thereupon disburses a goodly amount of vapor that spreads across much of the ocean, diminishing at all times. Wherever it goes, depending on its volume status, this vapor leaves in place a pattern of measurable effects on local TPW readings. Now assume that the baseline average for TPW for almost the entire area of the ocean surface is currently at or about 2kg. In fact, you can get an actual reading of 2kg today over a rather large area that surrounds Greenland and then extends just over the northern Canadian islands almost as far as Alaska. If you now mentally line up this 2kg zone with the exact same area on today’s anomaly map you will see how the warm anomaly magically disappears. There are many more such detailed comparisons to be worked out using 2kg as the baseline standard, with an assortment of interesting variations. As a final thought, with December now on hand, I would not be surprised if the most effective vapor streams all tend toward weakening from now on, allowing more space for colder anomalies to expand and start taking more regular turns. Now, as promised, here is today’s sea ice map. I think every bit of its edge is presently well behind the old normal in late-year growth:
Carl