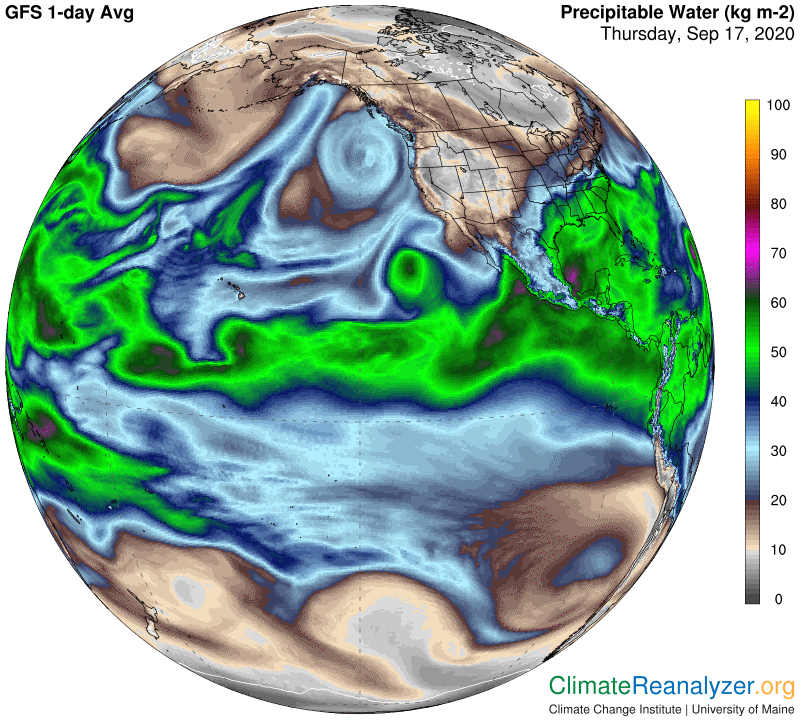
Today I want to leave a record of some things I see going on in the northeast Pacific Ocean area. We’ll start with an image from the PWat map, where the focus will be on a pair of streams emerging from waters to the north of Hawaii. One stream heads straight up toward the coast of eastern Alaska, where it basically stops and disintegrates. The other follows a more easterly course toward the coast of California. This one also does not go ashore, nor does it stop and disintegrate. (It probably does throw off enough vapor to cause anomalous heating in many western states as described here yesterday.) This stream has a curvature that allows it to continue by rolling up along the coastline all the way to the Gulf of Alaska, where it forms a wide loop that results in the formation of an inward spiral. This spiral is interesting because the vapor it contains doesn’t look like it’s able to either escape or disappear, but just accumulates.
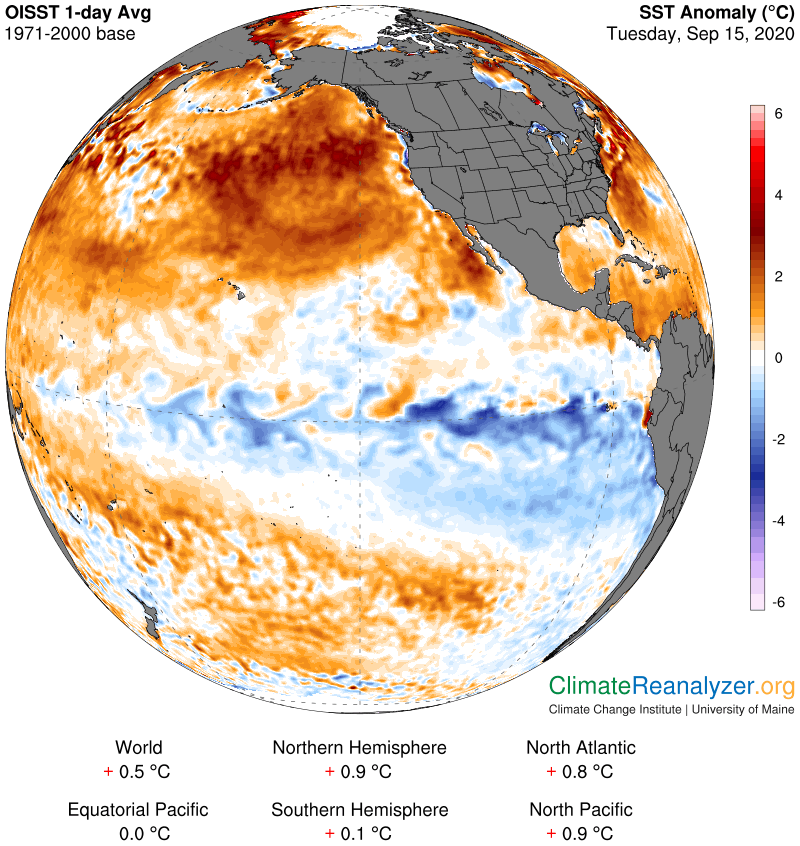
I have the idea that both of these streams have been active in approximately their current positions for quite some time, possibly more than a few weeks. That’s because of the ocean surface warming anomalies we see on this next map, which are sitting in very similar positions. Water temperature increases up to 3C degrees do not happen in one day, but could be built up over a longer period of time by greenhouse energy if enough vapor keeps passing over in the same place. The anomaly records assure us that nothing of the sort would have been there a few decades ago, but times have changed.
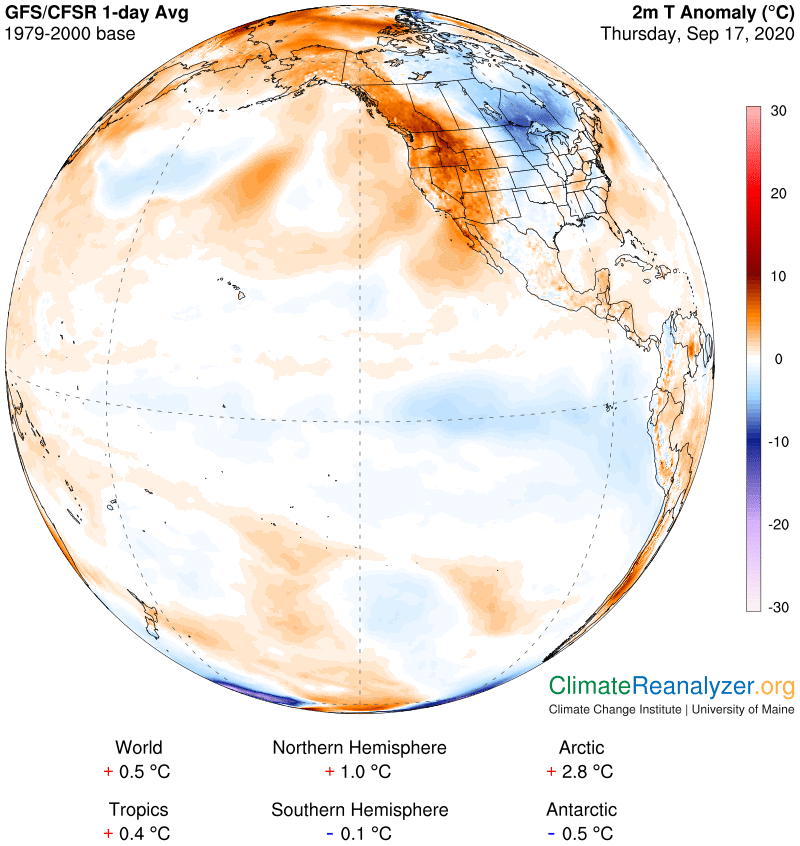
Air temperatures have their own story to tell, as we’ll see on the next map. The onshore anomalies due to vapor remnants thrown off by the streams are normal short-term effects, but not so for the significant air temperatures changes that appear over ocean surfaces. These are at all times largely reflective of heat exchange with existing water temperatures, which are relatively more strong and stable and may also have been building up by several degrees for independent reasons. There is one large patch of air anomaly that looks like it is at least +4C, which is a huge number for anything perched out in the middle of the ocean. I remember commenting on that patch when it was in about the same place a couple of months ago, so the cause, whatever it may be, must be extraordinarily durable.
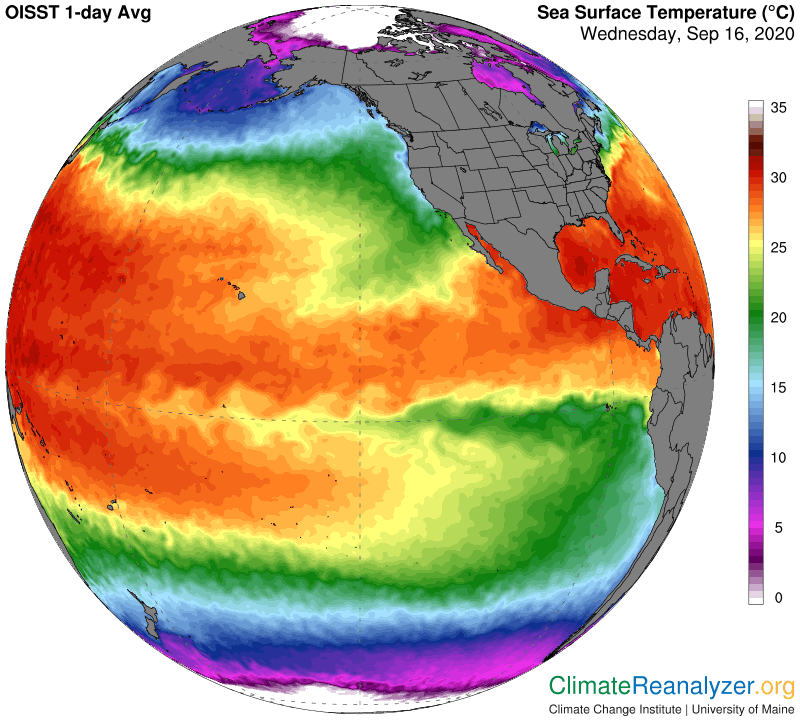
That brings us back to a big question that needs to be answered. Why are these vapor streams sitting right where they are, practically immobile, causing such large temperature increases to persist as real anomalies for weeks on end? They must have a source that could not have been there a few decades ago, which is what the anomalies are telling us. I think I have an answer about the identity of the source, and will show it on this next map. Using Hawaii as a point of reference, the bulge-shaped area of warm water temperatures you see just to the north and east of the islands could not have been that warm in the anomaly base period—by definition. If this water had been only a few degrees cooler it probably would not qualify as warm enough to create the massive amounts of vapor it now does, or to send streams of vapor high enough to reach the upper level wind system for long distance transportation. Streams that were previously enabled farther to the south and west could have gained energy from climate change and used it by expanding the ocean’s warm water pool in the direction of North America, bringing the edges of the pool closer and closer. That process may actually have created a feedback loop that is evolving and growing before our very eyes, with many undesired consequences. (South of the equator things are different.)
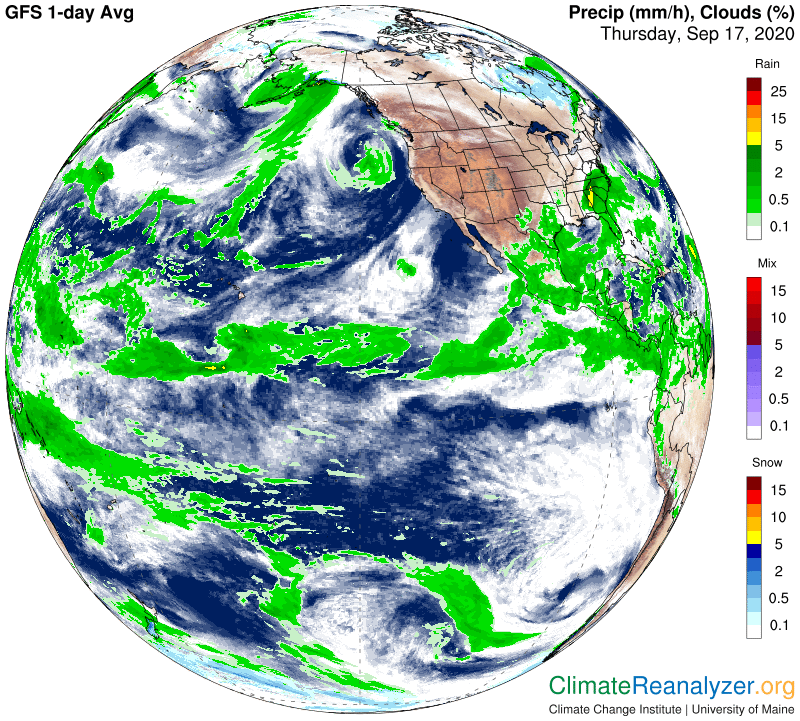
I need to throw in one more map, just because it shows what happens to the water vapor that gets trapped inside the spiral we were looking at in the first map. Otherwise there is hardly a cloud to be seen on that long vapor trail.
Carl