It’s an indisputable fact that air pressure differences have an extraordinary link to practically all parts of our planet’s weather system. Forecasters talk about it every day, how local pressure is changing and what changes in weather to expect along with it. What they do not say much about is what is causing pressure to change, or why in so many different ways. Is temperature involved? For me that has always been one of nature’s great mysteries. My personal discovery of the 500hPa weather map when it was introduced about three years ago didn’t help at all for a year or more until I finally decided to learn something about what it had ti say, and what to make of it. The effort has been worthwhile but the quest is far from over.
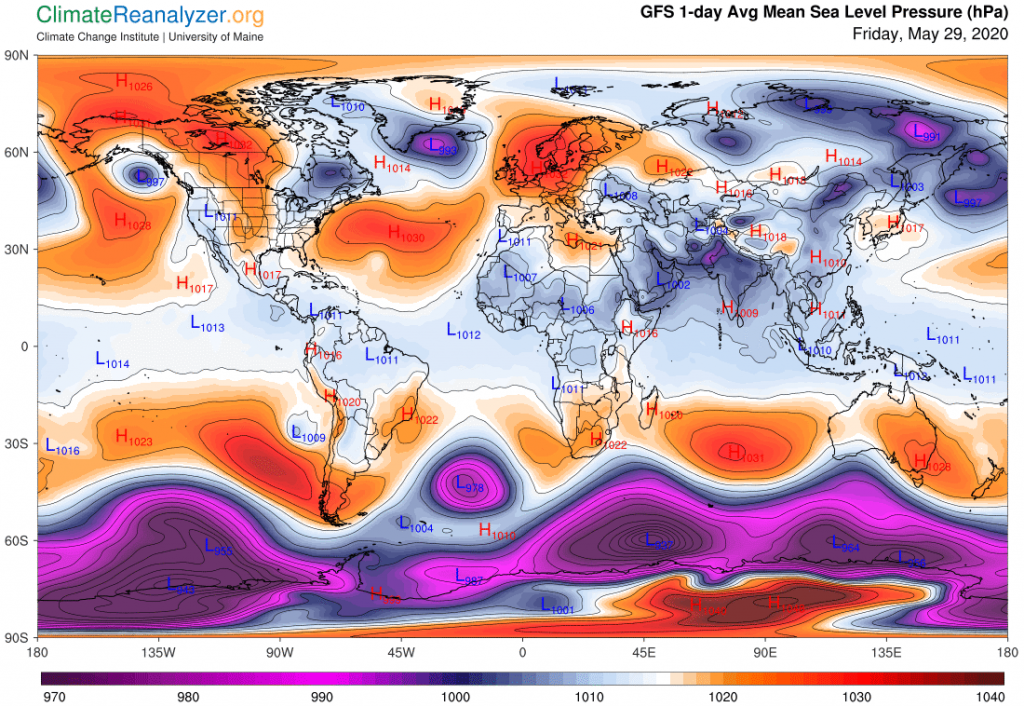
Today I am putting up two maps for comparison, to see what they are telling us that could be of interest. The first will show today’s air pressure configuration for the entire globe at the surface level, where we can see right away that there are major differences between the Northern and Southern Hemispheres. One or two small differences start near the equator and from there on the differences just keep growing and growing:
Now we’ll turn to the 500hPa map, showing how much the overall configuration has changed at an altitude of three to four miles above the surface. We know that all of the changes had to take place somewhere in between, but it is unclear just how far down. We also know from other indicators that there will be no further significant changes of configuration for at least the next four or five miles higher up. Here is the image, and once again you can see big differences between the two hemispheres that may need to be accounted for, except in this case the differences are not too meaningful until we get to either side of the 30 degree latitudes, after which they really multiply:
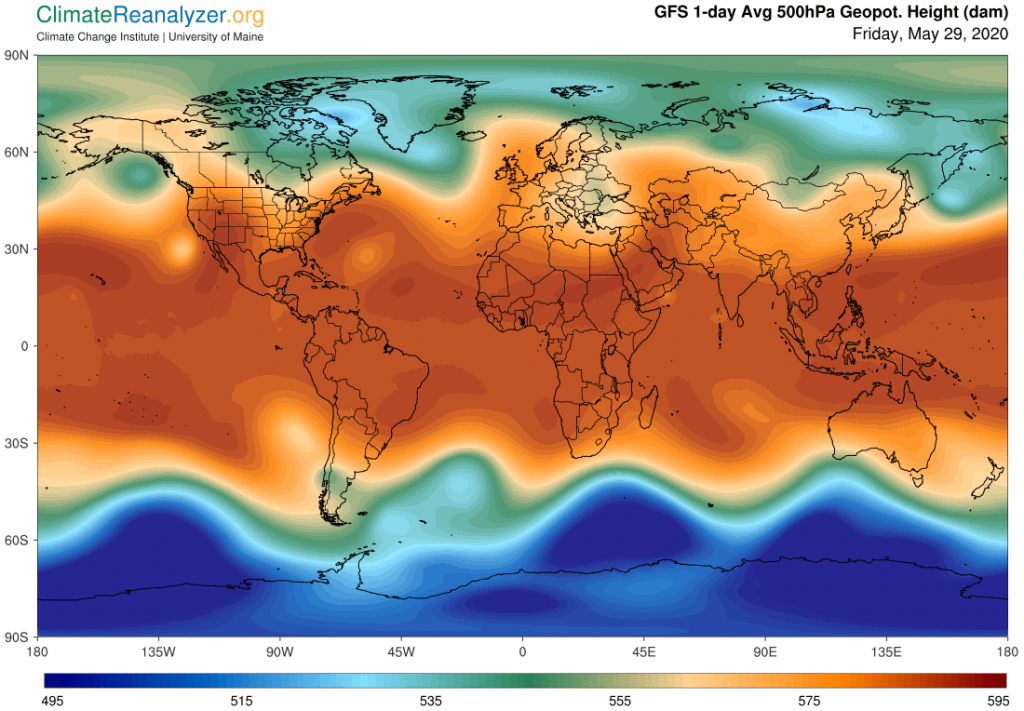
As a matter of special interest, when one compares how each hemisphere, just by itself, looks on each of the two charts, we see something curious. In the south, the general pattern of configuration separating the various high and low pressure zones does not seem to have changed a great deal with the rise in altitude, except for a small patch near the pole. The transition is quite regular in all directions, extending over a wide range of pressure levels, marked by a very large area of lows in the dark blue zone. In the north, meanwhile, that dark blue zone in the upper altitude is all but missing, mostly replaced by an enlarged green zone, which has otherwise been shrunken on its southern edge in favor of a light red zone that is now somewhat enlarged. The zone separation is altogether disorderly at this altitude, just as we have observed on the surface chart.
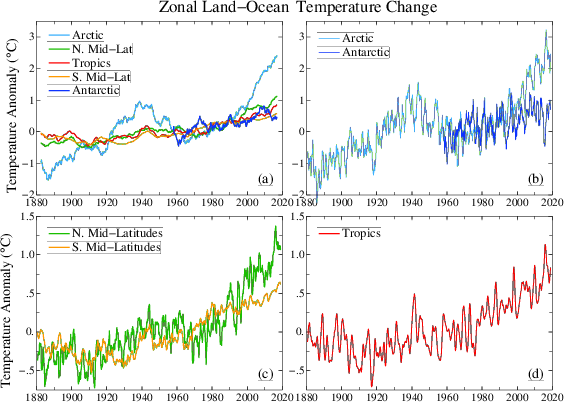
Past experience actually tells us that this is not a normal situation, that the two hemispheres should be much more alike when making this comparison, no matter what the season of the year. So that leaves us with some big questions: Why all the massive change in the one hemisphere, and why such a big difference between the two? It seems unlikely that something from outer space has anything to do with it, nor something on the order of a large volcano, or differences in materials that make up the atmosphere. There is no compelling reason left that I’m aware of, but one idea worth investigating comes to mind: We know that the Northern Hemisphere surface air temperature has been warming considerably more than that of the South since the beginning of this century, especially so in the polar regions, as indicated on these next charts. It seems possible, assuming some type of relationship exists between temperature and air pressure, that this may hold the key; and then, are there any feedbacks involved that could continue having further effects of a similar nature?
Carl