Today the weather maps are providing us with another vivid illustration of the way extreme temperature anomalies are formed. The process involved in this instance is exactly the same as the one that formed the big anomaly in the Arctic that I have written so much about. This time the anomaly has formed right on the edge of Antarctica, partly within the Antarctic Circle and its seasonally minimum amount of sunlight. The anomaly is smaller than the one in the north but almost as hot at the core, almost 20C, or around 35F. That’s a whole lot of heat for a place having practically no sun and a surface totally covered with ice at this time. Any curious person should want to know where it came from and why it is there, so let’s have at it.
Here again, I believe it all traces back to things that are happening high in the heavens, completely independently. The very first item in the sequence is nothing more than a slowly shifting configuration of air pressure in the upper troposphere, which is different in many ways from the configuration at the surface. The south polar view in this image shows much more stability and regularity than the view we’ve been looking at in the north, but we can still examine it for possibly excessive curviness or other potential weak spots:
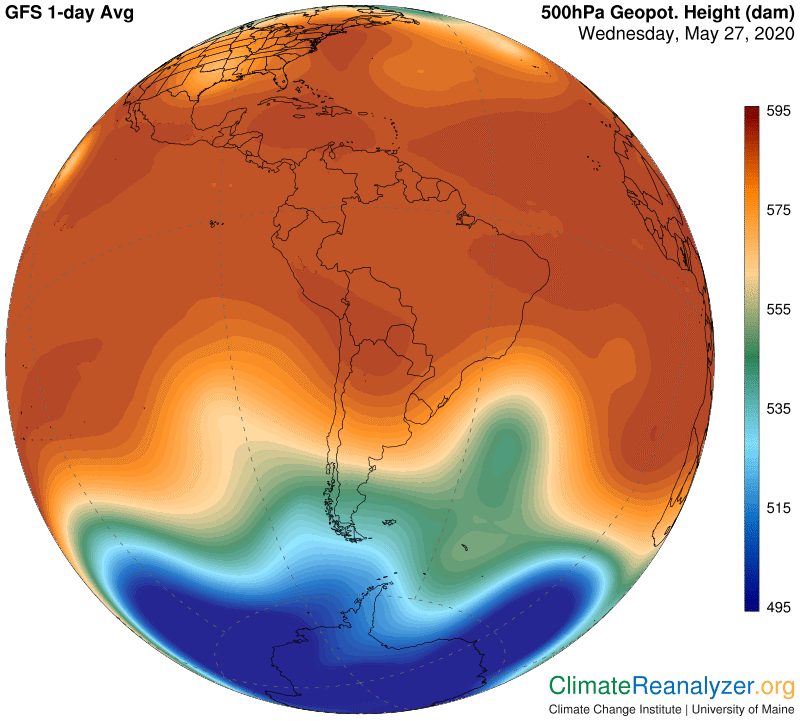
Yes, there are plenty of curves, and they could be are sharp enough to have an effect on the structure and strength of associated jetstream winds and their jets, which must adhere to the alignment of specific isobars within the configuration. (Go back and review the rules in CL #1683, May 21, if you need to.) Also, there is a big anomaly in the normally concentric alignment of pathways worth noticing, on the right side, where the paths marked by thin yellow and blue lines head off in opposing directions for a spell. Could this innocent looking anomaly actually become a major reason for why there is an extreme temperature anomaly on the surface of the planet many miles down below? Stay tuned. First, let’s see how the jetstream pathways have actually stacked up within the pressure configuration, to see how well they are following the rules:
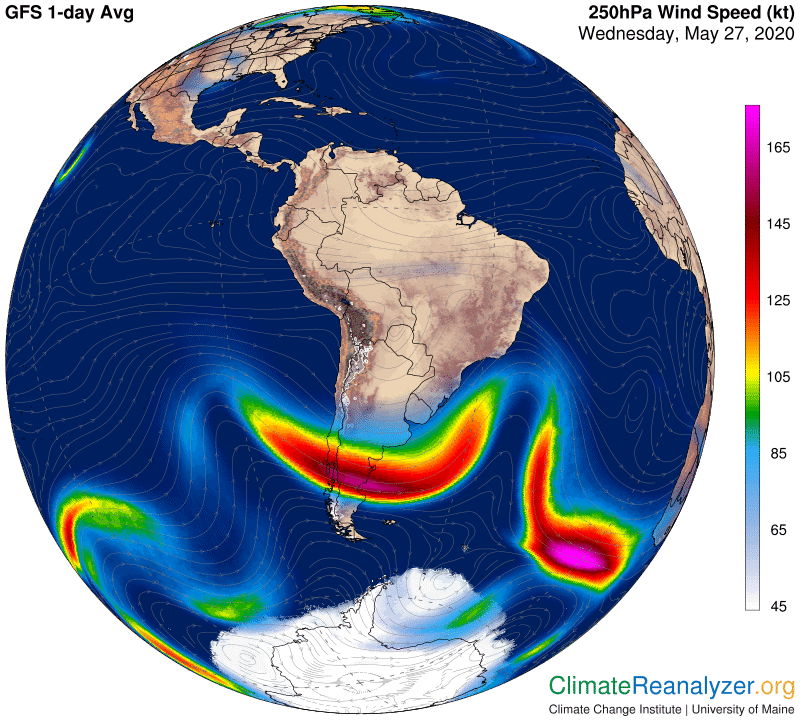
Sure enough, comparing the two charts, they are all in the right place. If you get up close to the screen you can even follow the isobars that hold each of the streams together, and see how the jets speed up when their paths converge, and otherwise tend to weaken, sometimes greatly so. Also, you may notice that the normal red pathway and its jets hardly show up at all within this section of wavy curvature, but they do become more active just off to the east. Their absence here may be seen as a contributing factor to the overall decline in strength for defenses needed to repel invasions of airborne water streams. As for the anomaly in blue/yellow concentricity seen in the pressure configuration, you can easily see how it has been realized, and then go back to the chart above and see how signs of confusion have developed on the yellow side where the green base that it borders has become extended and disturbed. What can happen when the usual defenses are altered in this way, and there are several strong invasive water stream forces on the doorstep? Here is the answer:
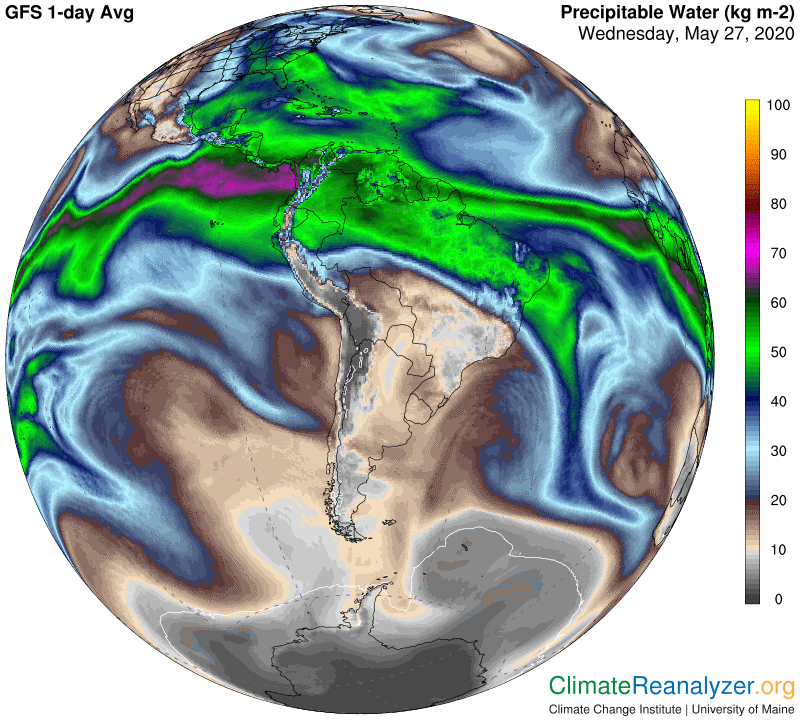
The streams have indeed found weaknesses and made significant advances in several places, two of which, on the left and right, are quite large and highly visible. In fact the most spectacular advance is the one in the middle, not quite so visible or well-defined until you see how and where it ends. This advance found its way through the yellow line defenses and across the anomaly gap we have observed, all the way to the blue line, which as we saw in the previous chart had retreated back to a position over the big ice shelf next to the Antarctic Peninsula. What the stream was able to carry with it, upon reaching the ultimate stopping point, was enough precipitable water to produce a reading of 12-13 kg over an area where the average might be closer to just 3 kg at this time of year. Such an increase, roughly equal to two doubles. would be enough (at 10C per double) to produce the extreme anomaly we see on this final chart, even if the water content was partly snow and not all vapor.
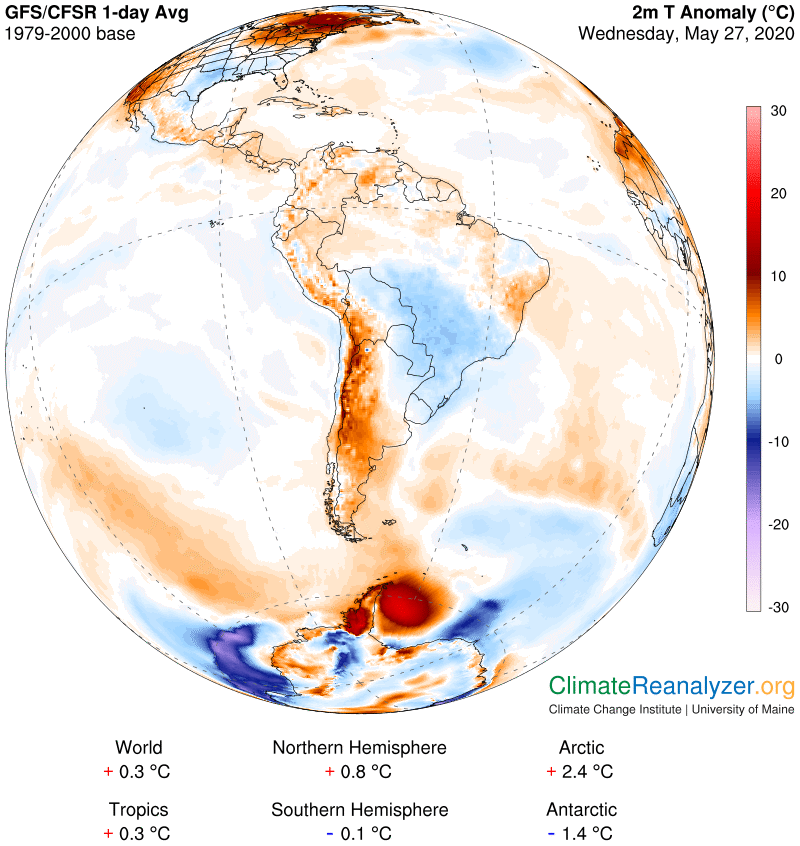
If there is a better explanation for this anomaly, can someone please tell us about it? And if not, what are the implications? See you tomorrow.
Carl